Support and resistance levels create the basis for building effective trading strategies and combine the principles of technical analysis. They confirm the change in quotes on the basis of certain laws, and the latter take into account everything (world events, news factors, technical rules).
What are Forex levels?
Quotes of currency pairs are constantly changing. But between news jerks, changes after trend movements, there are always periods of consolidation. Price begins to fluctuate around the "one axis". This is the basis for some trading strategies - in an uncertain down-up movement, you can find a trend indicating a further rise or fall in prices. This approach is implemented in the application of "candlestick figures."
Before trading, traders determine support and resistance levels for today. This allows you to plan further work:
- identify signs of a reversal or trend;
- enter the market in a calm period, when market and pending orders are opened at a set price;
- open a deal at the very beginning of the trend and get maximum profit.
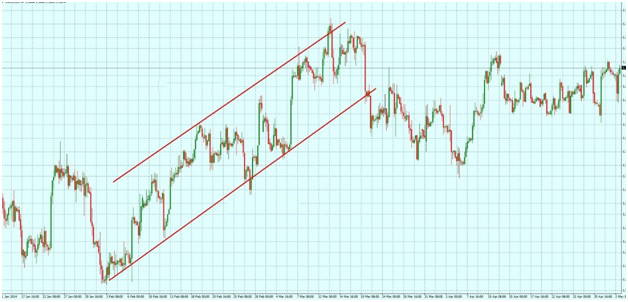
In addition to horizontal levels indicating the price of consolidation, traders also use sloping levels. They create the boundaries of the trend channel, within which quotes will change. Until the next news publication, this trend usually persists, which is used in trading strategies.
What is the difference between support and resistance
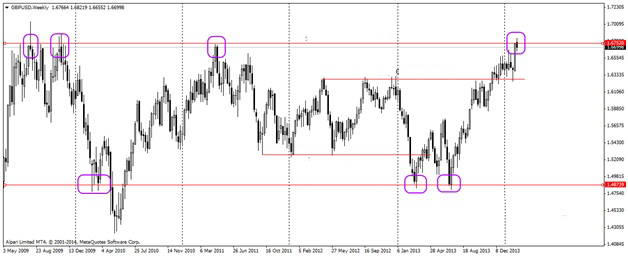
Visually, Forex levels are no different. A trader only notes quotes on the chart at which the price has stopped changing (with the exception of 10–20 points of up and down movement). But when developing a trading strategy, levels have to be divided into two types: resistance and support. This separation eliminates errors, introduces specificity in further actions.
When naming, adhere to the rules:
- If the current price is below the line, this is the resistance level. The term is based on the assumption that the market resists the “bulls” seeking to increase quotes.
- If the opposite is true, the market discourages the “bears” in their attempts to drop prices. Then the line is called the level of support.
At times of resistance, Forex traders track the trend of a downtrend. After all, the price can not break through the level and go further up. Traders are waiting for confirmation of a reversal (based on candlestick patterns, patterns, indicators indicators) and enter the market with sales. And so on until reaching one of the Forex support levels below.
Can support become resistance
Consolidation has a time limit. It is more often observed in the Pacific, Asian sessions, less often – in the European one. But with the transition to the American trading period, the price resumes movement. At this point, the levels cease to be an obstacle, and support can easily become resistance (and vice versa).
As soon as the price leaves the flat zone, the borders disappear that impede its growth or decline. On the chart, this is displayed as a a stair-step change in quotes up or down. Each jerk is accompanied by a small pullback (correction), but the movement continues. A pause occurs at the next level or as a result of the transition of trade to the Pacific, and subsequently Asian, session.
How to determine the levels
There are two ways to put Forex resistance and support levels on a chart. The first is to use indicators like Shved Supply and Demand. It automatically draws lines, regardless of the selected timeframe (TF). When switching TF, they are redrawn, new lines are marked, if there are any in the selected period. This feature is combined with manual display.
The essence of the technique is as follows:
- One of the senior time periods is selected. For example, H1.
- After marking with a level indicator, a horizontal line is drawn (using standard MetaTrader terminal tools).
- The period switches to a smaller one - M30, M15, M5 (depending on where the trade itself is planned).
On this chart you can no longer draw manually, but focus on the lines of the higher timeframe.
The manual method for calculating support and resistance levels requires only observation and knowledge of the built-in drawing functions. On timeframes H1, H4 and above, it is easy to see the points where the change in quotes stopped. At all levels, where this happened at least 2-3 times, a horizontal line is drawn.
Strong and weak levels
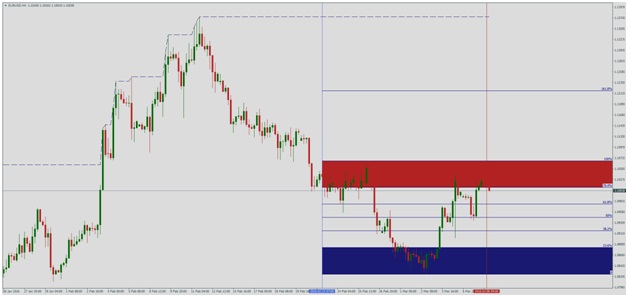
In the process of creating the current picture on Forex support levels and resistance, you can pay attention to the characteristic behavior near various lines. Some only slightly delay the progress of quotes along the trend, while on others, a reversal most often occurs. In the latter case, we speak of a strong level. Their indicators are displayed with a bar showing the flat range.
At weak levels, the range of price changes is usually noticeably lower, no more than 5-10 points (on accounts with a 4-digit quote). On the strong - from 15 and above. The first category is used to transfer Stop Loss orders to breakeven, to place additional pending orders when working with a “ladder”. Entering the market with the first deal on them is possible only in the direction of the trend, provided that to the nearest strong level there are enough points to make a profit.
Powerful levels attract increased attention. After all, the trend can turn around and continue on them. It all depends on the market situation, when the price approaches the next of them. Discussions are particularly heated ahead of news like Nonfarm. Bursts that occur when they are published, can move the auction to a different range. Or drop the price from the level and reverse the trend.
Price channels
In addition to horizontal lines, traders use inclined channels consisting of two parallel lines at the borders of the price spread during its trend movement. When both types of levels are marked, it is easy to see the boundaries where the risk of a trend reversal is high or it is the right moment to enter the market.
The following rules apply:
If the price bounces at the point of contact between the horizontal and dynamic levels, you can open a deal in the direction of rebound. But keep in mind that from the entry level to the middle of the channel there should be a distance of the amount of the desired profit plus the spread size (in points).
When the level is broken, first open / close the candle, aimed at the reverse movement beyond the line. If this does not happen, the price continues to change in the direction of breakdown, you can open an order directed towards the ongoing trend.
In trading, it is useful to consider all levels, both weak and strong. Traders who build trading on them usually draw maximum information on the chart and update it daily. With this approach, favorable entry points and moments when you should refrain are clearly visible.
Features of trading at levels
The creation of profit-making techniques at Forex resistance levels is based on the events of “breakdown” and “rebound”. Next is the separation between lovers of aggressive and conservative trade. There are already incompatible ways to determine the entry point into the market, exit with profit or loss.
Typical strategies look like this:
- Aggressive trading: a trade is opened immediately after the breakdown, if at least half of the time is left, before the period, the trader is working in, is over (there is no reason to risk closing a candle, there is a chance of opening the opposite).
- Conservative trade: an order is opened only after "confirmation". This can be another candle, closed behind a broken level.
Conservatives, according to the aggressors, “lose time”, but their approaches to making a profit are different. The former tend to squeeze maximum points out of one transaction, while the latter are more likely to exit the market within a minute or less. Stop Loss orders also differ in the number of points. If a conservative approach involves anticipating developments and setting a closing point at a loss at a broken level, short-term strategies take into account a short time in the market and often do without Stop Loss.
How to avoid mistakes
The profitability of trading strategies lies in the strict implementation of the rules. Any deviations from them can lead to losses. The same applies to level trading. The graph does not have precisely defined values for stopping the trend, you can only see the range of the flat state. When drawing horizontal and sloping lines, you have to focus on experience, which is much safer to acquire on a demo account. All brokers offer the opportunity to practice without the risk of losing real money. Technically, trading is the same with a demo account and a real deposit. Therefore, before applying an unfamiliar strategy, it is worth practicing with the funds of a broker.
The main thing is to develop the ability to adhere to discipline. Always place Take Profit, Stop Loss orders at the specified level. Observe risk management in proportion to the amount of funds on deposit (maximum number of simultaneously open transactions, optimal lot). Then the risks of losses will be minimized.