Traders have been using indicators of technical analysis for a long time. These algorithms automatically reflect the behavior of quotes, greatly facilitating the process of analyzing the market and helping to build trading plans.
One of the most common tools is the RSI indicator (relative strength index). It can be called the legend of technical analysis. The algorithm makes it possible to really assess the strength of the current trend and determine the likely points of its reversal.
History and Brief Description of RSI
The tool was developed back in 1978 by Wells Wilder, the well-known founder of various concepts of technical analysis. In his books on trading systems, the author described in detail the essence of the RSI indicator.
The result of the publication of the book was the increased popularity of this tool among many market participants. When trading on Forex, RSI is used in the MetaTrader platform. It works for all assets and all time frames. By type, the algorithm is an oscillator. The amount of profit depends on the chosen trading strategy.
General description of the algorithm
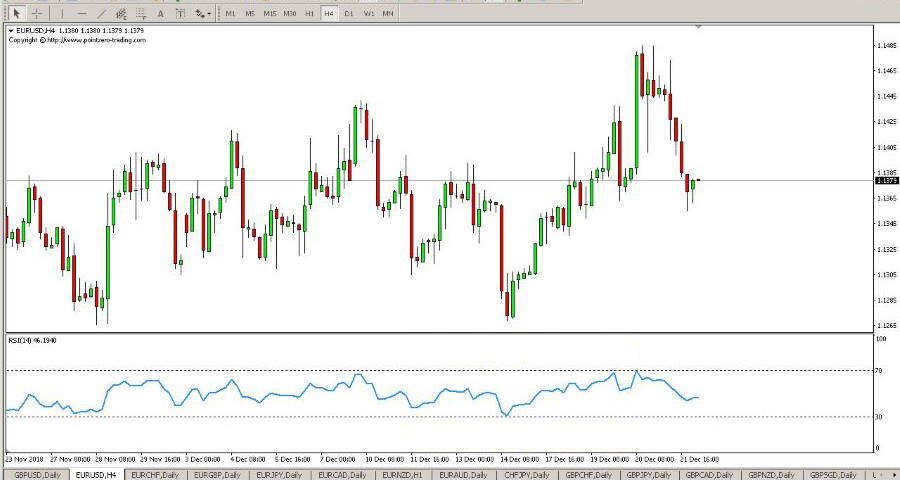
The RSI oscillator fluctuates in a certain corridor between the maximum (100) and minimum (0) values. It works on the speed of price changes, displaying results in the above range. The greatest effect from the operation of the oscillator is observed when it is near its extremes.
The range from 70 to 100 is the overbought zone, from 0 to 30 is the oversold zone. When the RSI reaches the first range, a price drop is expected. The option of staying in the corridor from 0 to 30 signals further price growth.
It should be noted that borders 30 and 70 should not be taken as dogma. Some experienced traders using RSI in their trading strategies advise changing these values to 20 and 80. Especially when the market is dominated by a pronounced bull or bear trend. Then, thanks to the use of these boundaries, entry into the market is carried out more correctly.
However, in the case of an uptrend or downtrend, logical questions always arise: how long will RSI stay in the border zones and how to determine the moment of its exit from them in order to correctly open a position for buying (selling)? The author of the indicator himself recommended using a period of 14. Some traders, in addition to this value, use 9 and 25. Depending on the timeframe, these numbers are the number of candles used in the calculations (minutes, hours, days, etc.).
Any trader, trading the selected asset, can choose the optimal period for himself experimentally. To do this, you need to consistently change the values to monitor the overbought and oversold ranges. When pronounced (reversal, key) extremes on the price chart begin to be displayed by the instrument in these areas, and the rest are outside of them, it is believed that the value for the period is selected successfully.
It should be remembered that a period with a lower numerical value affects the sensitivity of the instrument. The RSI curve will give more false signals. Increasing the period will make the RSI indicator smoother and filter out incorrect tips.
Characteristics of overbought and oversold zones
On the screen of the trading terminal in the basement window of the chart, levels 30 and 70 are displayed as lines. They are used to receive signals in order to open long and short positions.
The oscillator crossing line 30 from top to bottom indicates its location in the oversold zone. When the RSI curve crosses this line from the bottom up, the trader considers this circumstance as the opening of a long position. If the indicator crossed the border 70 from the bottom up (entering the overbought zone), and then again from the top down, a sell order opens. Such market entry rules are acceptable only for the movement of the main trend. Against the trend, the opening of the corresponding orders is fraught with possible losses.
However, the oscillator can be in these areas for quite some time. Therefore, you should analyze such situations, depending on a number of circumstances:
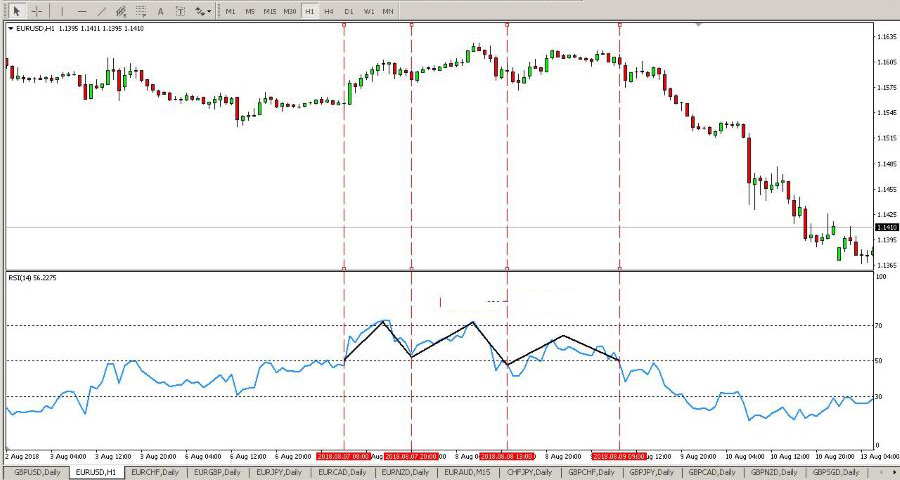
- In the case of the usual "sideways" price movement occurs in a certain corridor. The intersection of RSI levels 70 from above and 30 from below will be a good signal to enter the market for sale and purchase, respectively. This can be seen in the figure below. With a narrow flat scalpers have a great opportunity to significantly increase their profits.
In the case of strong upward movement, the oscillator, having crossed the boundary 70, can stay in the overbought range for a long time. It is more advisable to neglect its testimonies until it crosses the level in the opposite direction. This will be a good signal to start sales.
As previously mentioned, values 30 and 70 are subject to change. For example, market participants trading in a bullish trend use values of 40 and 80 for levels. With a pronounced bearish trend, it is convenient to use 20 and 60.
Some traders recommend applying the “5% rule”. This means that the level line is drawn in such a way that the Forex RSI indicator remains behind it no more than 5% of the total time for a certain time period. You can test it on historical data for the last three months. Subsequently, all data is updated.
When the market is not characterized by sharp volatility, levels 30 and 70 practically do not intersect with the oscillator. It is possible to increase the amplitude of its oscillations by reducing the period in the calculations. If the oscillator is excessively sensitive to price changes, then the period should be increased and thereby eliminate market noise. The moment of completion of the transaction is associated with approaching overbought or oversold zones. As soon as the oscillator reaches their borders, the position should be closed. Some leave trades open and pull stop-loss closer, hoping to get even more profit, as the price movement may well continue in the same direction.
Technical Analysis Figures
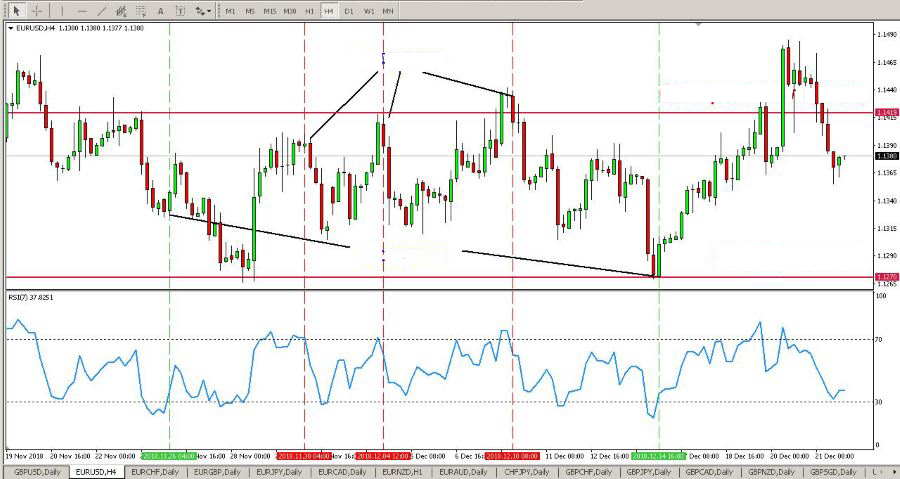
Using the RSI indicator in trading, you can enter into transactions using the graphic figures that the tool draws in the basement window. These can be “triangles”, “banners”, “double peaks”, etc.
In the figure of the EURUSD pair, a head-and-shoulders reversal pattern is clearly observed. On it you can enter the sale, having received a good profit. A level of 50 is suitable as a neckline.
Divergence
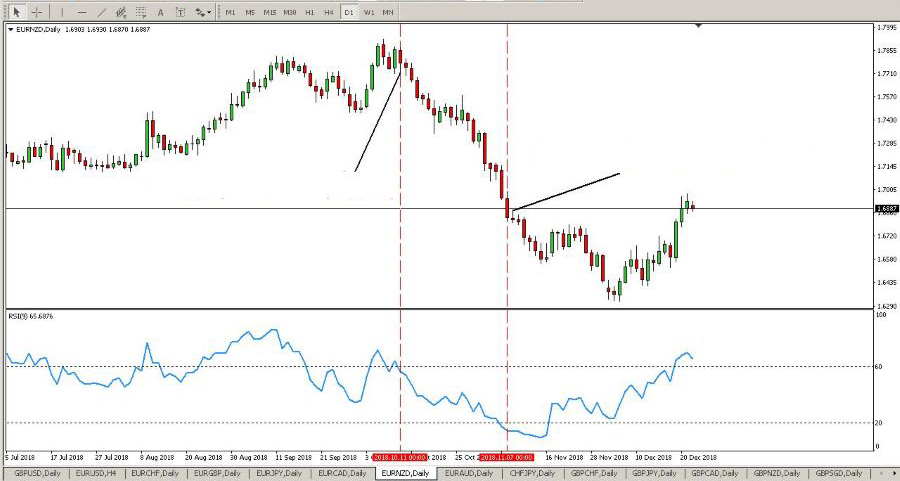
The indicator can be an assistant in predicting the further movement of the main trend. By displaying divergence (the discrepancy in the basement window and on the chart of the traded asset), the instrument predicts an imminent price reversal in the future.
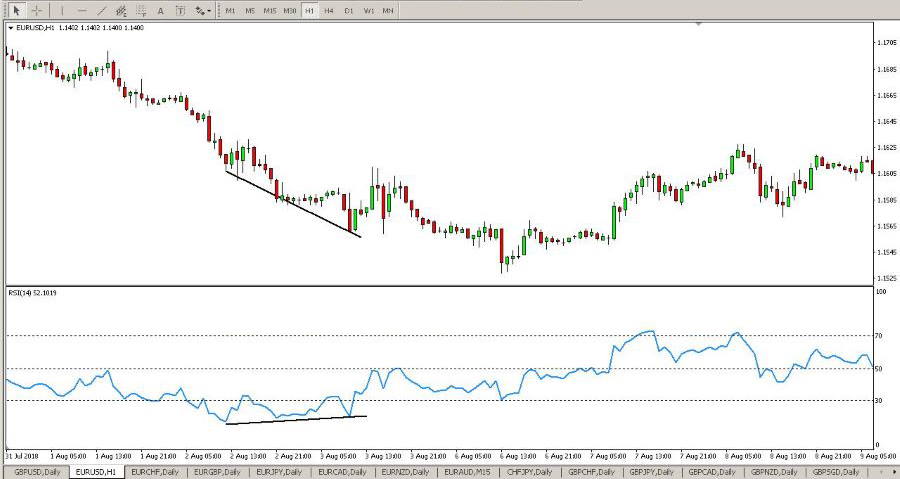
In this case, a strong reversal signal is observed on the chart - divergence below the level of 30 RSI. Such a signal must be taken into account in trading with an already open position. It should be closed to avoid possible losses.
This discrepancy can be observed in two cases:
- with an increase in the price trend, RSI decreases;
- with a downward trend, the RSI curve rises.
The tool is best used along with other indicators of technical analysis. This will help filter out false signals. Testing is preferably carried out on a demo account, and only then trade with real money.