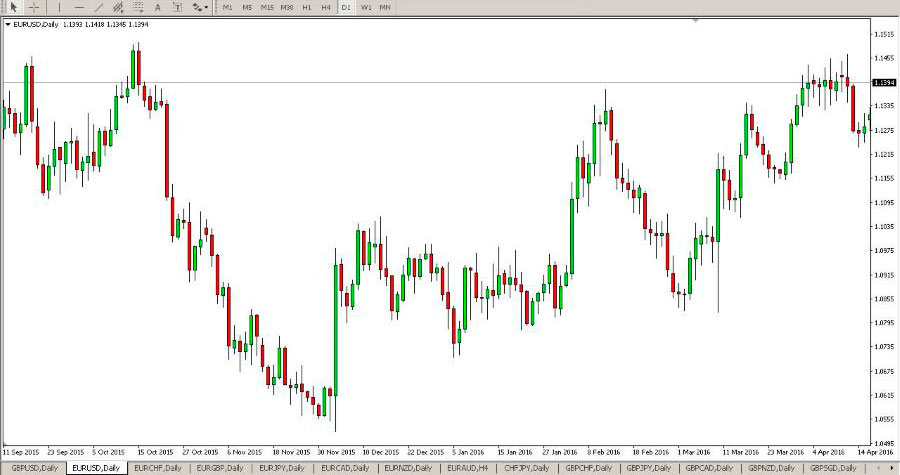
The most convenient option for charting any asset on Forex is Japanese candles. The information content and the state of the market’s data visibility presented by Japanese Candles have long earned popularity among all traders. It is the technical analysis of Japanese candles that makes it possible to forecast further price movement for various assets.
This technical analysis tool helps traders to see and understand the mood and psychology of the market.
What are Japanese candles
Correctly reading asset charts, correctly determining support and resistance levels, technical analysis of candles helps any trader. These methods combine the appearance of a price line with a variety of interval graphs. The graph perfectly displays the fluctuations in the quotes of all assets for a certain time period.
For a more complete understanding of the tool, you should consider its components in more detail:
- a candle body is a rectangle
- shadow is a line extending from the body
These two components look like a candle. Each of them displays the price change for a certain time interval. Candlestick chart analysis helps in making market forecasts. And in this case, they do well without computer indicators. You can also anticipate the reaction of market participants to certain events.
A significant advantage of such a chart is that the candle is the equivalent of several indicators: opening and closing times, information about the prevalence of sellers or buyers in the market. Each candlestick corresponds to the timeframe on which it is displayed. On the time interval M1, one candlestick displays the price change in one minute, on 5M - in 5 minutes, on 15M - in 15 minutes, etc.
In addition, candlestick elements display various graphical figures on the trading terminal screen that are used by traders to open/close or buy/sell orders. Therefore, the candlestick chart greatly simplifies the comprehensive study of any market. Defining this or that pattern in time, the trader has the opportunity to prepare a trading plan and, acting according to its points, enter into transactions, making a profit.
Information from candlesticks on the chart
How to read candlesticks on a chart? This question is invariably asked by novice traders.
The information provided by candles at all time intervals is similar:
- opening quotation for a period of time (Open);
- closing quotation for the same period of time (Close);
- price minimum for the period (Low);
- maximum price for the period (High).
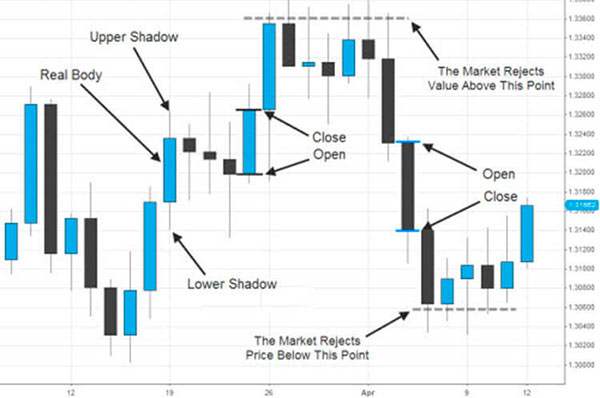
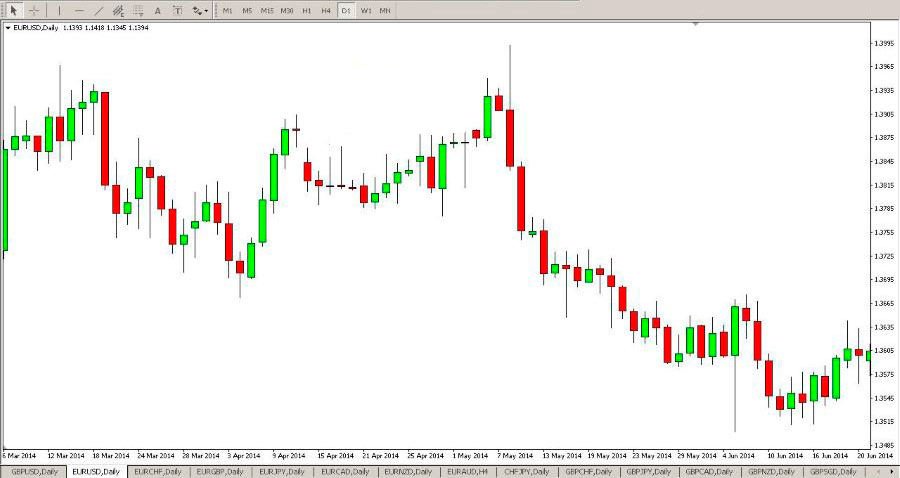
The figure shows that the opening and closing quotes are the frame of the candle element. It is commonly called “the body”. Thin strands extending from the body up and down are the shadow that is sometimes called a “wick”.
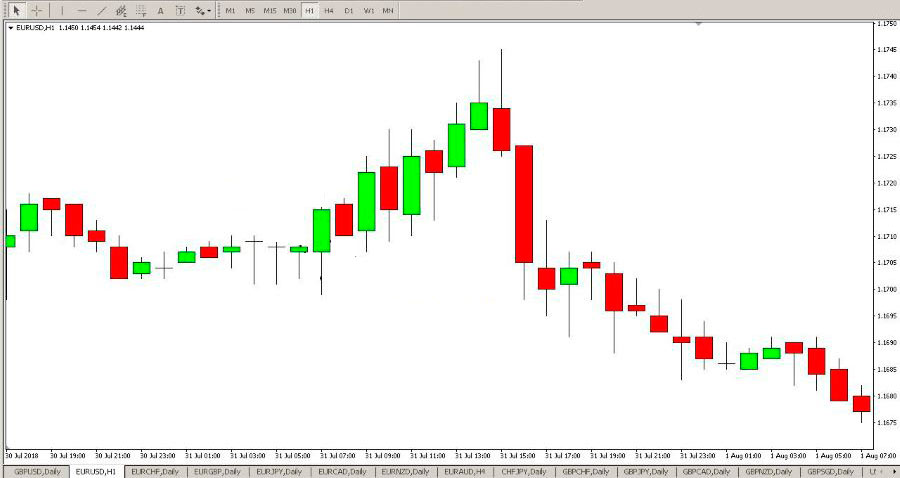
It is customary to distinguish between bullish (increasing) and bearish (lowering) candle options. In the first case, its formation occurs from the bottom up. Here, the opening price acts as the lower limit, and the closing price is the upper limit. Typically, on the MT4 terminal chart, such candles are colorless or colored green. A bearish candle is the exact opposite of a bullish candle. It is formed from top to bottom, painted in red or black. Opening price - its upper limit, closing price - lower.
In some cases, the body of the Japanese candle is absent. This happens when the opening price is equal to the closing price. Sometimes there is a lack of wicks in the candle element. Here all the parameters are equal: opening quotes, closing quotes, minimum and maximum.
Candle reading
Japanese candles, how to read them correctly? The study of such charts comes down to the identification of graphic patterns in the form of combinations of candle elements. There are a lot of similar models represented by several elements and each of them has a specific name: “hammer”, “hanged”, “shooting star”, “doji”, “tombstone”, “hara” and others.
Any of these patterns signals the moment of entering the market. There are continuation trend models and trend reversal patterns. The latter constitute the vast majority.
When analyzing candlesticks in trading, important features should be taken into account:
- all studies are best done on a daily timeframe. At shorter time intervals, the reliability of signals from candlestick models is reduced. The smaller the timeframe, the lower the reliability;
- forecasting of long-term trends is carried out at monthly and weekly time intervals;
- after emerging reversal patterns, the trend does not always change. Sometimes a trend or flat correction occurs. Therefore, the reversal model rather predicts a change in the current market situation.
This is explained by the balance of sellers and buyers. The more orders are opened in one direction, the higher the probability of a reversal. Market makers closely monitor the market and, with a certain number of bidders, “bring down” the price, forcing it to turn around, make a correction or go into a flat.
- Patterns with price gaps are more reliable.
- Any combination of candles must be confirmed. For example, if a bullish pattern has formed on the market, then the next candle should show market aspiration.
Display of market psychology by Japanese candles
How to analyze Japanese candles? The answer to this question helps to understand the psychology of the market, in other words, the intentions of most sellers and buyers. Even beginners, having made certain efforts, will be able to learn how to analyze candlestick elements to predict further trend movement.
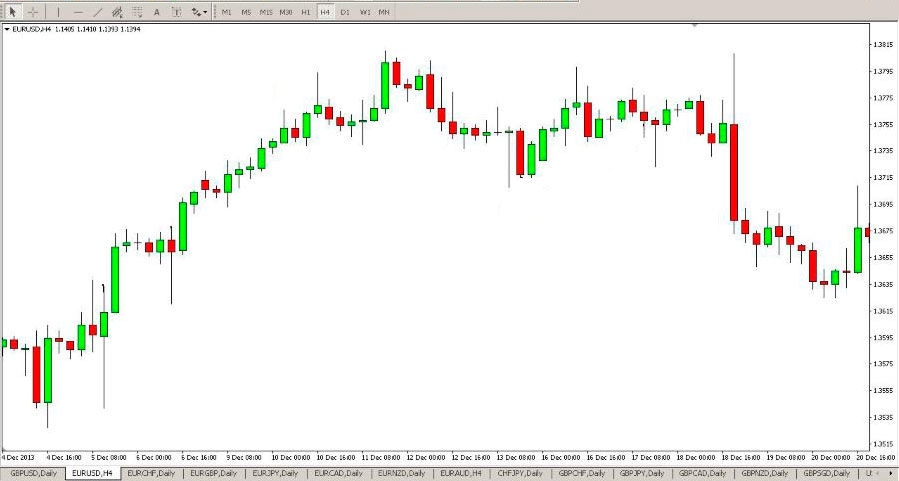
One of the most important parameters of a candle is its body size. Its length indicates pressure on the bull or bear market. If the body of a large size (relative to neighboring candles) has a white (green) color, it means that bullish moods prevail, and buyers prevailed over sellers. Confident victory sellers is displayed by a large dark (red) body. Its insignificant size indicates the approximate equality of forces between sellers and buyers. This means that a rollback (correction) of the dominant trend, or a further flat movement, is quite likely. In such cases, the trend “freezes” for a while before the next jerk up or down.
When a bullish candle formed after a long downtrend appears on the screen of the trading terminal, there is every reason to assume that an upward trend is emerging. And the close of the bullish candle above the resistance line indicates that the market has strengthened at a new price point. But such a statement will take place only upon completion of the formation of the candle element. For a more detailed view of this process, you should switch to a smaller timeframe.
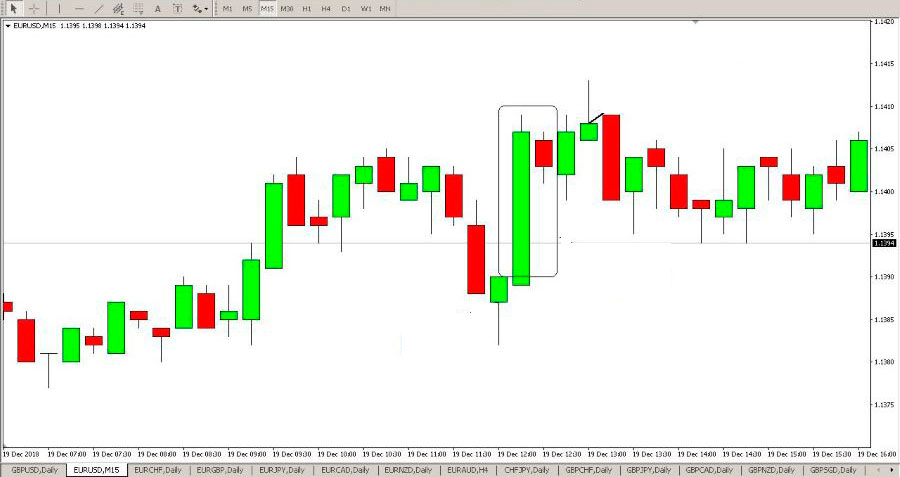
The tail (a wick, often referred to as a pin-bar), departing from the body reflects the mood of market participants, or rather, its change in the process of forming the candle itself. The pin-bar is quite often a harbinger of a change in the prevailing trend or its continuation after an appropriate price pullback. Long wicks, as a rule, form near a strongly tested, but not broken level.
When the struggle between sellers and buyers reaches its maximum, “doji” with long pin bars appear on the screen. This indicates the indecision of market participants - against the background of active trading there is no result.
Candle mood
Such a concept was proposed by Lance Begs, a well-known Forex trader and specialist in the price action algorithm.
The mood depends on the position of the closing price relative to the previous candle element. It is customary to distinguish several types of mood:
- Bullish. Closing price is above the last high;
- Bearish. Closing of the period below the previous minimum;
- Neutral. Last candle close in the range of the previous candle.
In turn, each of the species can be high, low and medium. This is the intensity of the mood. It is determined depending on the place of the candle range where it was closed.
Candlestick chart study
Japanese candles, the technical analysis of which is beyond any competition to other graphical market research, can give the trader a lot of useful information about upcoming market changes.
Candle bodies are of paramount importance, their shadows are of secondary importance. Wicks are considered market noise, although it should be considered in any trading.
Such chart studies take into account certain fundamental principles:
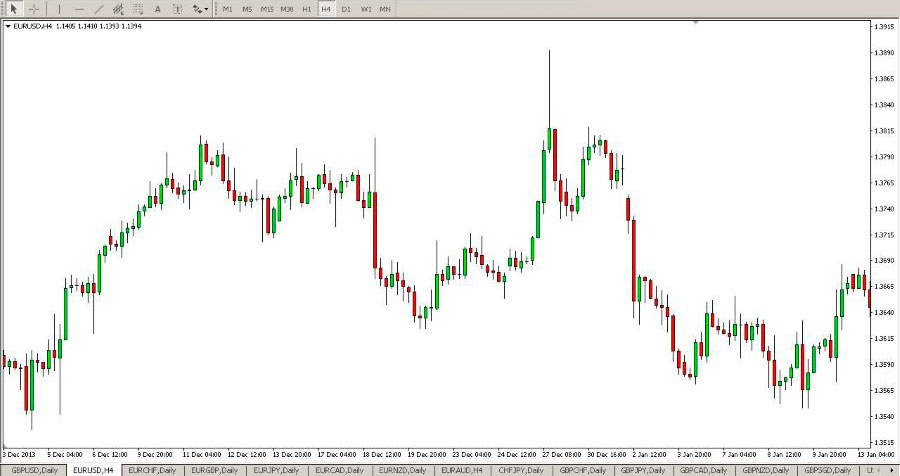
- long bodies with short wicks are the foundation for the forming a new trend. This is a pronounced superiority of buyers over sellers or, conversely, sellers over buyers. As a rule, the longest candlestick bodies are located at the beginning of the trend and at its end. If the order was opened in a trend, then the appearance of long-bodied elements is a signal to close the deal;
- candles with short bodies and long wicks are often formed when the trend reverses. The best signal of this is an element in which one shadow extremely exceeds the length of the other shadow and body. This shows the struggle of bulls and bears, in the process of which at first some won, but in the end the championship went to others;
- small bodies and wicks appear when lateral trends appear. At this point, you can open orders with small Stop Loss.
Conclusion
The use of Japanese candles is characterized by both positive aspects and certain difficulties. The reliability of these elements, in contrast to computer indicators, makes it possible to examine the price itself, and not mathematical calculations. Candles are universal. They are applicable for asset graphs of all markets - currency, commodity, stock, etc.
However, novice traders have some difficulty in comprehending this tool. You should make some effort and spend time to thoroughly understand the candlestick analysis. But the results of labor, clearly, will not be wasted and will help to earn good money.