The USDCHF currency pair, on the D1 time-frame, made a short upward move until February 20 when a higher top was recorded at 0.98481. Bears found the price attractive at that level and supply overwhelmed demand.
After the top at 0.98481, the market fell through the 15 and 34 Simple Moving Averages and the Momentum Oscillator broke through the zero baseline into bearish territory. This could have warned technical traders of a possible price reversal or formation of a new trend.
The likely reversal was further strengthened by the crossing of 15 and 34 Simple Moving Averages, a so-called Death Cross and the occurrence of a series of Strong Bearish Japanese Candlesticks during the downward break.
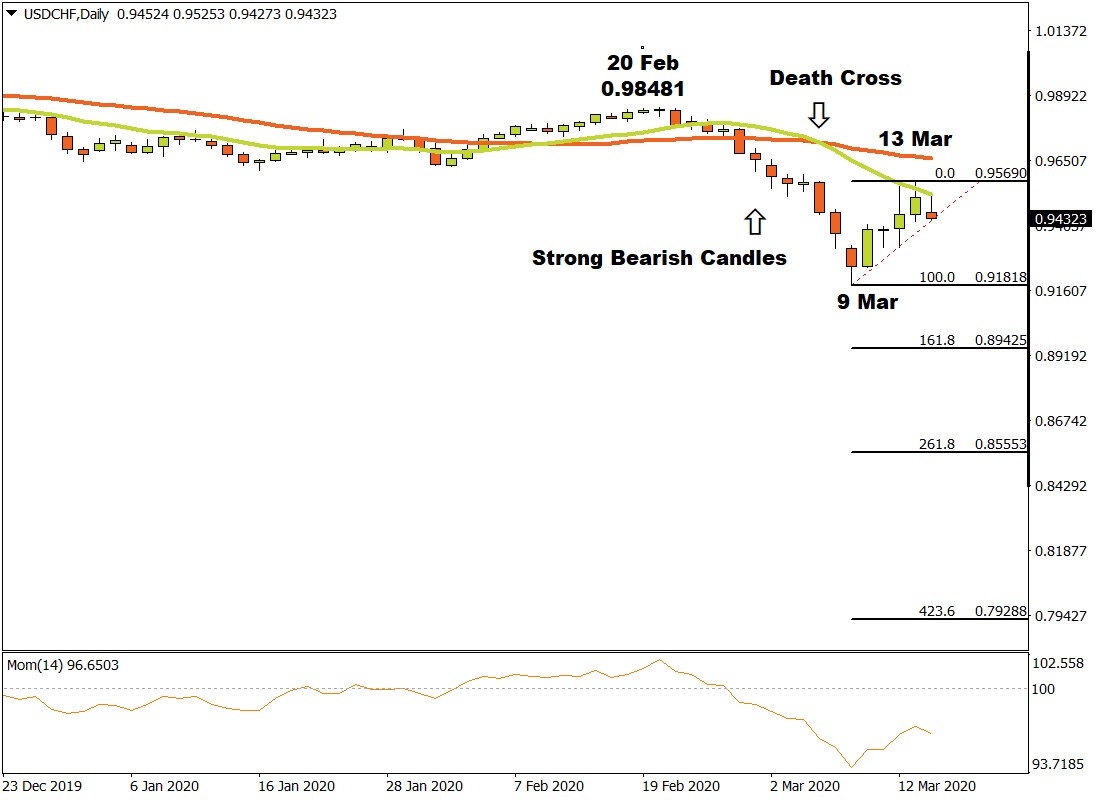
A possible critical support level formed when a bottom was recorded on March 9 at 0.91818. Buyers tried to pull the market higher but the price found resistance on March 13 at 0.95690 and sellers are currently trying to push the market lower.
If the USDCHF breaks through the critical support level at 0.91818, then three possible price targets can be anticipated from there. Attaching the Fibonacci tool to the bottom at 0.91818 and dragging it to the resistance level at 0.95690, the following targets can be calculated. The first target is estimated at 0.89425 (161 %) and the second price target can be calculated at 0.85553 (261.8%). The third and final target may be predicted at 0.79288 (423.6%).
If the 0.95690 resistance level is broken, the anticipated price targets above are thereby nullified, and must be reassessed.
As long as sellers maintain a negative sentiment and supply overcomes demand, the outlook for the USDCHF currency pair on the Daily time-frame will remain bearish.