Many beginning traders do not understand why forex forecasts are necessary. However, analysis of financial markets has been and remains the main guarantee of success of a forex trader. So, how to make an accurate forecast? How to predict forex market direction? Today we will talk about different tools that help a market participant to analyze and make the right decision about the advisability of the trade at this time, to extract the maximum possible profit from it.
What is Forex?
Many people call forex a stock exchange, but that is not quite true. In contrast to the stock exchanges, forex works 24 hours a day, because the world's banks are located in different time zones. In addition, Forex is not tied to a specific place - it is a virtual market, and you can play it from anywhere in the world. The main thing is that you have access to the Internet and access to the market provided by the intermediary - the guarantor of the transaction, which will be concluded on his behalf and at his expense. Such an intermediary for small and medium-sized customers is a prime broker, with whom an agreement is concluded. You have to realize that the small trader just can't go directly to the market because of the lack of funds, because the standard size of the lot on forex is $100,000.
Currency rates are changing every minute - this fact is the basis of the idea of trading forex. For example, if you buy Euro for $1.2, and the next day it rises in price to $1.3, you can sell it and receive a profit of $0.1. And you can benefit from both rising and falling rates, i.e. you can either buy cheaper and sell more expensive, or sell the currency at a higher price and buy it back when the price goes down.
Currency rates are affected by various factors: economic indicators and policies of national banks, political changes, force majeure (for example, natural disasters, accidents at large enterprises, terrorist attacks, and even weather conditions), as well as rumors, sentiments, and expectations of market participants. However, despite all this, forex is characterized by relative stability, because the fall of one currency always leads to a change of rate of the other, and an experienced trader can take advantage of it with considerable profit.
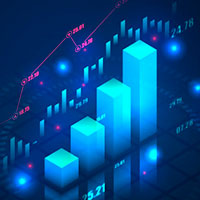
Defining a Trend
The concept of a trend in the financial markets refers to the movement of an asset's price in one direction. It can be upward, downward, or sideways. In the latter case, it is customary not to speak of a trend, but its absence and to use a special term for such a situation - flat. The strength of the trend is a particularly important tool for technical analysis. The liquidity of financial assets depends on the degree of change in the value situation. It is worth understanding that the trend is not formed by all upward and downward points. Only the peaks are considered. The peaks of the growth of the rate are the support line, the negative results are resistance.
The correct calculation of the current trend is the key to successful asset trading on the foreign exchange market. It is important to understand that stock trading is never stable or cyclical. Rates are constantly changing, especially for active trades or currency pairs, which are influenced by some factors. So, you can fix the direction of change in the quote only once, after a while the vector will change.
The trend will help users to schematically determine the history of variation of the asset price at a specified time frame. Thanks to this data investors can forecast the situation, form a strategy. Exactly the trend line allows the clients of brokerage companies to achieve the maximum efficiency of using the trading instruments and to achieve the best profitability.
Using Moving Averages as Trend Predictors
Moving Average is one of the "oldest" technical analysis indicators employed by traders in manual mode before the advent of computers, it is now present in all popular trading terminals. It is considered one of the best tools for determining the trend for any trading asset (forex, stocks, indices, cryptocurrencies). The purpose of the Moving Average is to smooth out the market "noise" to show the true direction of the trend line. The average chart acts as a dynamic support/resistance level. The sum of trade asset prices for a certain historical period is used for calculation, for example, 14 days, and then divided by the number of days.
Thus, the Moving Average indicator calculates the arithmetic mean of the prior price movements for each moment without considering the noise. The calculation can be performed by the open/close prices, high/low prices. Other variants, such as the median price, can be found in terminals, but they are not widespread, most strategies use the Close prices.
The reliability of the signal is determined by the number of calculation periods, and not only by moving to higher time frames. The more of them, the more significant is the difference of direction or the Moving Average breakout. For example, 200-periods show a medium-term trend, when they are broken out, there is usually a complete trend reversal or vice versa the current movement will continue shortly.
It is believed that if the price is higher than the average, there is a market uptrend, respectively a downtrend if it is lower. In case of a sideways movement Moving Average indicator goes in parallel, it is necessary to use additional channel indicators to open deals, which may also be built based on averages. In addition to the Simple MA (SMA), the next variants of the indicator, which are regarded standard and are assed in most trading platforms, are widely used.
- Exponential (EMA). In contrast to the simple one, which does not make a difference between the calculated price bars (periods), suggesting that they are equally meaningful indicators EMA considers the most important recent data. From the close of the current price, importance decreases exponentially from the first most sensitive bar to the last calculated bar, which has almost no effect on the definition of the trend.
- The EMA algorithm lets you to respond quicker to market fluctuations to trade more effectively on small (up to H1) timeframes. Most scalping and intraday strategies use the Exponential Moving Average. As the periods increase the sensitivity decreases, when it reaches more than 100, there is no significant difference compared to the SMA.
- Linear Weighted MA (LWMA). It is a modification of the EMA with another algorithm of assigning values (weights) of the periods. Also, the last bar has the highest weight, and then the importance decreases more sharply relative to the Exponential. It reacts even more to sharp price changes, that is why it is used more on the stock market, where trends are initially more smoothed in contrast to the volatile forex. There are some versions of the indicator where not only the calculation period but also the value of weights is adjustable.
- Smoothed MA (SMMA). This Moving Average indicator works on the inverse principle: most past periods have a greater weight, which then successively decreases to the current bar. Thus, the movement of the smoothed graph becomes more stable to small price fluctuations without increasing the number of periods. It is used rather seldom and never as the main element for making trading decisions.
Predicting Exchange Rates in the Short-Term
Technical analysis is most applicable to short-term trading. It predicts the price movement and helps to find the patterns of this process based on experience. For this purpose, charts are used, which display all the information required to decide to place a trade. Among the most helpful tools used to predict forex market direction are sentiment surveys and Stochastic indicator.
Sentiment Surveys
Market sentiment is the attitude of all its participants to the market, which is expressed in the activity and price movements of financial instruments. If most market participants forecast the emergence of an uptrend, then it is customary to talk about the prevailing bullish sentiment in the market. If most traders' opinions are in favor of the reduction of the price, then the market has a bearish sentiment. In other words, the market sentiment is the prevailing forecast of traders on the behavior of any instrument. The market sentiment is determined by the orders of its participants, i.e. when the majority of traders and investors either sell or buy assets. How can the online forex market sentiment be determined? There are a lot of ways to find out the current market mood quickly and accurately. We suggest you pay attention to the most popular, stable, and reliable resources.
For instance, Reports of Commitments of Traders is one of the main fundamental sources of information about the sentiments of market participants - from small speculators to large institutional investors. Reports on activities of these structures are made based on data of the American organization CTFC regulating activity with securities at the US financial market. All brokers and large companies, making transactions in the market, according to the American laws, provide it with information.
The analysis of COT reports greatly contributes to the trader's understanding of the market mood. However, you should remember that the Friday reports are based on the data for last Tuesday and considering that the data is received in the evening, you can use them in trading only after the weekend, which creates a certain time gap, which must be considered. The purpose of this organization is not to support stock speculators. The main purpose is to monitor the honesty and transparency of the deals of the major players in the futures market. But the information contained in the COT weekly reports can serve as a good indicator of the market conditions. Using this tool, the trader understands not only where the main volume is located, but also in what mood the market is.
While COT reports are a fairly accurate indicator of market sentiment, it should be remembered that they do not offer a one hundred percent guarantee that a trader will open a position in the right direction. Like other sentiment indicators, they are not signals for entering the market, but only a complementary element of market analysis. Market sentiment helps a trader not only to evaluate the emotional and psychological attitude of other parties but also it is a useful indicator letting to make exact short-term forecasts.
Any indicator which shows the market sentiment helps an investor to improve the precision of his forecasts and to track the probable points of pullbacks and trend reversals. When the traders' sentiment beats the critical historical values for a certain financial asset, the probability of the end of this trend increases many times, which must be considered when opening a position. The critical values of the sentiment indicators are one of the signals of profit-taking by trend positions and preparation of positions for the change of trend.
Stochastic
The task of technical trading tools of the Stochastic class is to perform a technical analysis of the market speed by the relative position of the closing price in the max/min range for a certain period. With this indicator, the trader should estimate the probability of extremum updating, i.e. - chances of the current trend to continue. The author proceeds from the fact that the Close price of the current period must be in the zone of the previous maximum price on a stable rising trend. On a downtrend, respectively, it should stop near the previous min value. Stochastic contains several mechanisms of "price noise" filtration, which makes it more accurate than, for example, William's %R oscillator.
The Stochastic, as a typical oscillator, has a separate percentage scale in the range (0;100) and is located in an additional window under the price chart. Besides the base (calculation period) and additional parameters, the Stochastic uses the balance line (50) and levels of critical zones - 70(80) and 30(20). In the modern market, one should not focus on the conditions of the author of the indicator (period from 9 to 21), the main parameter should be chosen independently, and all the "standard" recommendations - must be tested. The longer the calculation period, the less sensitive Stochastic becomes - it lags harder and considers most of the price fluctuations as "unimportant". The most reliable signals are on H4 and above, but scalpers and intraday traders are unlikely to be satisfied with it.
The optimal parameters depend on the time frame and the volatility of the traded asset, for example, the default setting (5/3/3) works well for popular currencies, in low time frames (up to M30) the period 9-13 shows stable results, the recommended parameters for H1 (13/5/3), for H4 and above - the period from 5 to 9. Interestingly, a different set of Stochastic parameters is usually used for controlling the breakout of critical zones and for searching for divergence situations. Stochastic lines (growth or stable movement) in the upper range from 70 (80) to 100 are interpreted as a bullish, but overbought market, the fall or movement in the area below 30 - the market is oversold. From the fundamental point of view, the market leaders (bulls or bears, respectively) gradually become weaker, and the indicator dynamics slow down. Eventually, the balance of players shifts in the opposite direction - there is a reversal. The behavior of lines in critical zones shows the direction and strength of the reverse price impulse. If the indicator moves in the zone of level 50 - the probability of a trend change is minimal. Stochastic uses the trading logic characteristic of impulse technical instruments, so the strongest signals are breakout and reversal signals.
Futures Market
Futures contracts are fixed-term assets, i.e., they have a final closing date (expiration), before the execution date, i.e., the client can voluntarily get rid of the obligations undertaken. To keep the position longer than the expiry date, you need to switch to a later contract regularly. If you do not close the futures contract in time, the broker will close it forcibly and the price will not be the best. Most speculators hold an asset for a fairly short time. The futures are, first, volatile, because on the real exchange the proportion of short-term speculators is also quite impressive. But with a reasonable approach, such activity can bring a stable income in intraday forex trades. Nervous reaction to fundamental news or force majeure can be compensated by analysis of related markets.
The heterogeneity of the volatility of the futures has a permanent effect. Even if the average "life" of the contract is from 3 to 6 months, the main trading volume in it occurs in the last 3 weeks (for short-term contracts) or the last 2 months (for long-term contracts). It complicates the long-term analysis. Immediately after the contract opening, it lacks liquidity - there are sharp price fluctuations, closer to the closing date a stable, but still, too strong volatility appears. As a result, when the forex asset comes to a strong support/resistance level, the futures asset may not react to it because of its "freshness" or it may give false signals because large volumes of transactions are fixed before the current contract is closed.
Since a futures is a transaction with two parties (seller/buyer), the number of open positions shows the degree of interest of bidders in a particular price movement, and the more open interest in a particular futures, the more price movement you should expect. The data on the Open Interest is taken from the CME reports or other exchange resources. The closer to the expiration time of the futures, the more trades are fixed in it. The market for the asset becomes thin with gaps, the big players with large volumes, who speculate and shift the price in the direction they want, activate on it. At such moments, the futures price cannot be used as a guide or a source of trading signals for CFD assets or currency pairs.
In futures trading, there is no locking and no swap, but there is rollover and there is clearing. There is always a difference between the spot prices and the futures prices - the difference is highest when you open a new contract, and it decreases as you get closer to the contract closing date. In addition, price calculations are complicated by differences in the same asset but with different maturities.
The insider factor most of all affects the major futures (oil, gold, S&P500, dollar index): having important information before the main market, the big players before the news artificially move the price against the logical movement, to make the bulk of traders jump into the market, and in fact, after the news release they quickly unload the accumulated position. That is why, contrary to technical analysis, even on negative data the underlying futures always give short-term impulses in the opposite direction and quickly rollback, which is very dangerous for small deposits with insufficient Stop-Loss.
Predicting Exchange Rates in the Long-Term
Fundamental analysis is very important for long-term investing. Here currency rates are closely linked to changes in the economic and financial situation in the world as a whole and specific countries. Political processes, statements of world leaders, cataclysms, actions of major banks, etc. are also considered. One of the useful tools traders can apply to predict market direction is Purchasing Power Parity, particularly, Big Mac Index. Let`s find out more about it.
Purchasing Power Parity: Big Mac Index
When The Economist first presented the Big Mac Index 36 years ago, it was developed as a fun and amusing way to calculate Purchasing Power Parity. Now, this index has evolved one of the most cited and trustworthy global standards that traders rely on, and which is also introduced in many economic textbooks. Purchasing Power Parity is an economic theory comprehended as a "basket of goods". It is used as a benchmark to calculate whether the two currencies being compared are in equilibrium.
The two currencies must be in balance when both are placed in the basket and must have the same value in each country. The theory states that exchange rate fluctuations between currencies affect the price that consumers will ultimately pay for a hamburger. PPP is a metric used to compare economic variables as they vary from country to country. One of the key attributes of the model is that it is formed without regard to exchange rate changes and possible distortions.
This is the problem for forex traders who want to use this model in their day-to-day trading. Forex traders need exchange rate data to make informed investment decisions. Unlike Purchasing Power Parity, the Big Mac Index is based on exchange rate discrepancies and directly reflects the value and depreciation of currencies. This makes it a much more effective indicator for forex traders. The Big Mac is also a tangible item, not a concept like PPP.
Since its inception, the Big Mac Index has been a priceless means for forex traders who want to find a link between a currency's long-term forecast and its exchange rate. Traders who use the index to forecast the market perceive the discrepancy between the index and the real exchange rate as a measure of potential future exchange rate corrections. In other words, the index links the forex market to commodities and indicates the direction in which the market can go. As with most theories, this correlation only works until it stops working. Since various factors can affect the value of a hamburger, the exchange rate is not always an accurate indicator of the strength and direction of the market.
But the main reason the Big Mac is not a reliable indicator is that it does not consider small short-term fluctuations in the foreign exchange market. It only works for the long term and, consequently, will not be useful for those who need the short-term analysis. Combined with other indicators, the Big Mac Index is an immaculate tool worth knowing how to use.
Conclusion
Forex traders will always prefer one type of analysis. While it sounds perfectly normal, and we encourage you to choose the type that suits your trading strategy, the most successful traders can still combine elements of all types. Use fundamental analysis to check the overall economic direction picture for deviations from the long-term trend. Back it up with short-term technical analysis to determine entry points with even greater accuracy. Lastly, assess market sentiment to make sure you are not trapped by changing market forces.
There's a well-known saying that everyone knows: "Knowledge is power." That's why you can't stay in the dark when the information that can help you make a profit or, more importantly, keep you away from losses, is right in front of your eyes.