The price of AUDUSD, on the D1 time-frame, was in a prolonged down trend until March 19 when a lower bottom was recorded at 0.55073. The attractive price caught traders’ attention and buyers started entering the market aggressively with long positions.
After the bottom at 0.55073, a possible price reversal was confirmed when the market pushed through the 15 and 34 Simple Moving Averages and the Momentum Oscillator broke the zero baseline into bullish territory.
The reversal was further supported by a higher bottom and a new bullish impulse wave that formed during the upward market advances.
A posssible critical resistance level formed when a top was recorded on April 14 at 0.64443. Sellers capitalised on this and tried to push the market lower but after forming another higher bottom on April 21 at 0.62532, buyers again overcame the negative sentiment and demand provided the price a leg up to rush upwards.
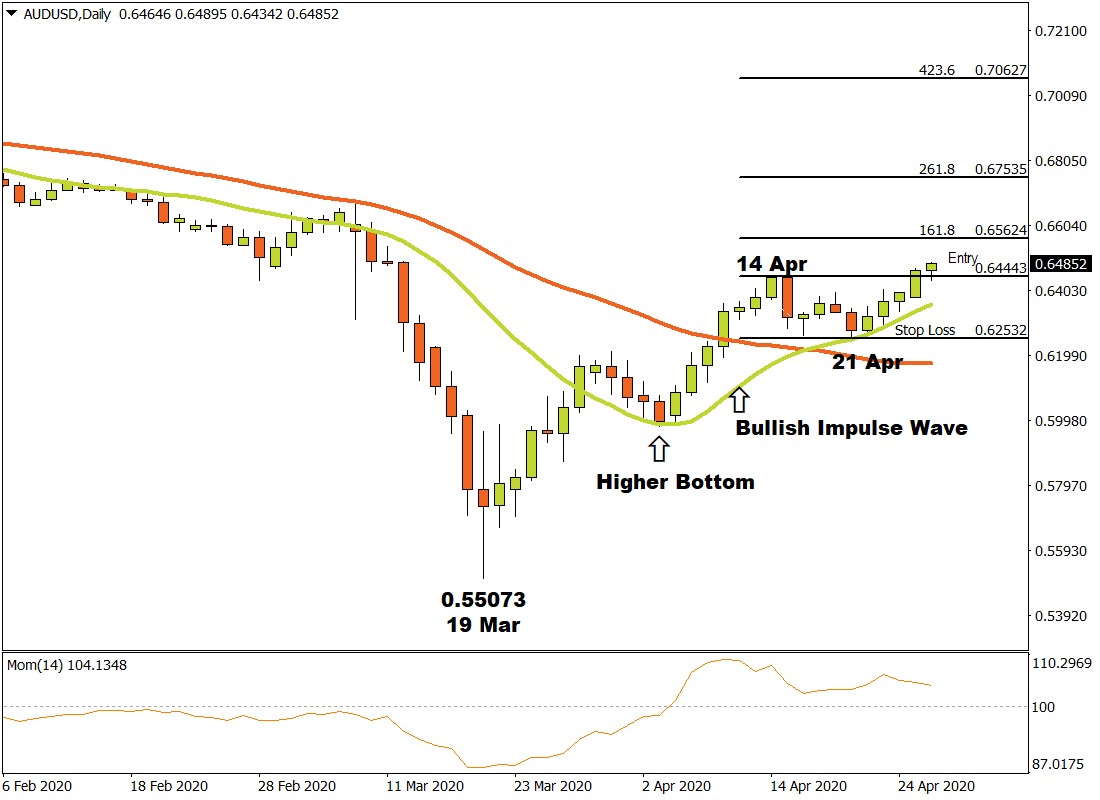
On April 27, the AUDUSD pair broke through the critical resistance level at 0.64443 and three possible price targets were calculated from there. Applying the Fibonacci tool to the top of the resistance level at 0.64443 and dragging it to the higher bottom at 0.62532, the following targets were considered. The first target is estimated at 0.65624 (161 %). The second price target is calculated at 0.67535 (261.8%) and the third and final target is projected at 0.70627 (423.6%).
If the 0.62532 support level is broken, the anticipated price targets are therefore annulled.
As long as the price continues making higher tops and bottoms, thus confirming an uptrend is in place and demand is overcoming supply, the outlook for AUDUSD pair on the Daily time-frame will remain bullish.