The Aussie on the Daily time frame has been in a prolonged down trend until a lower bottom was reached on 20 August at 0.71061. After the lower bottom, bulls started charging ahead and the price broke through the 15 and 34 Simple Moving Averages. The Momentum Oscillator also confirmed the bullish momentum by breaking through the baseline into bullish territory. A possible critical resistance level was formed when a top was reached on 3 September at 0.74781. Bears are currently trying to pull the market lower but bulls might stop them at the 0.73210 support level.
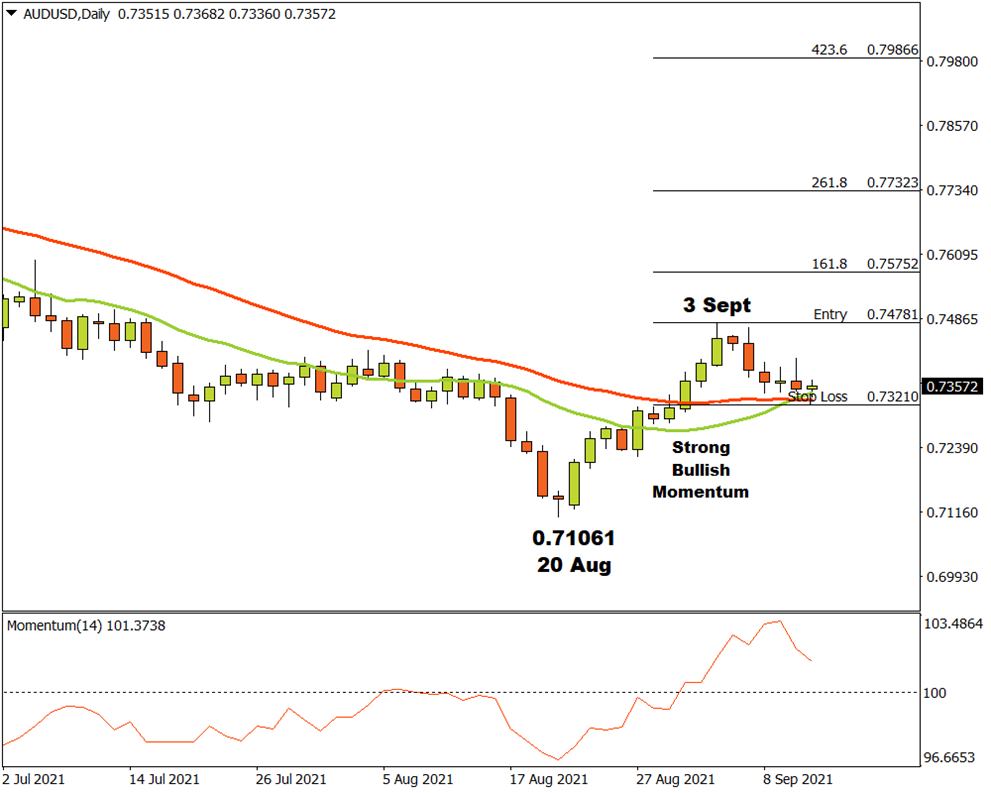
If the Aussie manages to break through the critical resistance level at 0.74781, then three possible price targets can be considered from there. Attaching the Fibonacci tool to the higher top at 0.74781 and dragging it to the bottom of the possible support level at 0.73210, the following targets can be calculated. The first target is estimated at 0.75752 (161.8%). The second price target can be forecast at 0.77323 (261.8%) and the third and final target might be anticipated at 0.79866 (423.6%).
If the support level at 0.73210 is broken, the above scenario is no longer in valid. As long as the bulls continue to dominate and demand overcomes supply, the outlook for the Aussie currency pair on the Daily time frame will remain bullish.