The Aussie on the D1 time frame was in an uptrend until 5 April when a last higher top was recorded at 0.76614. The market then broke through the 15-day Simple Moving Average (SMA) and almost touched the 34-day counterpart. The Momentum Oscillator also changed direction to the bearish side. All of these indicated to traders that a possible shift in market momentum was possible.
A critical support level formed when a lower bottom was recorded on 12 April at 0.73993 and during he same day the bulls drove the price upwards. A resistance level at 0.74936 was however hit on the same day with a lower top forming.
The bears then gathered enough momentum to push through the critical support level at 0.73993 and on 13 April a short position was engaged. Three possible price targets was projected from there. Attaching the Fibonacci tool to the lower bottom at 0.73993, and dragging it to the resistance level at 0.74936, the following targets was calculated. The first target was estimated at 0.73410 (161.8%). The second price target was calculated at 0.72467 (261.8%) and the third and final target might be expected at 0.70941 (423.6%).
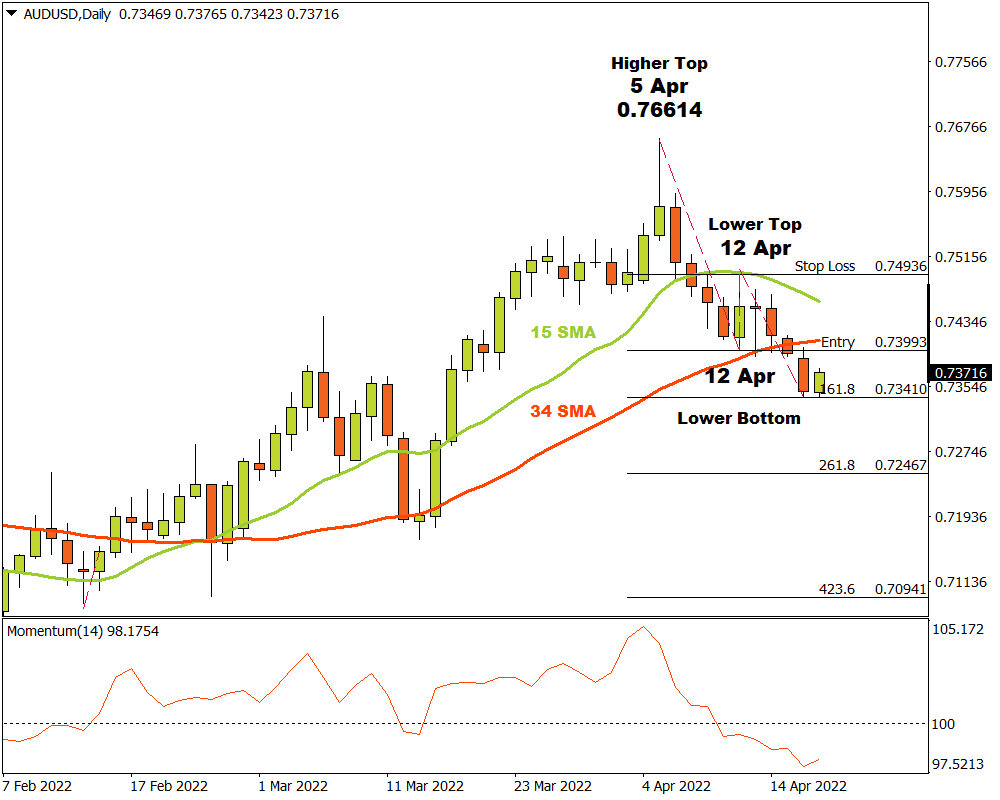
If the resistance level at 0.74936 is broken, the above scenario is not valid any longer and any open positions must be closed. As long as market participants continue with their negative sentiment and supply overcomes demand, the outlook for AUDUSD on the D1 time frame should remain bearish.
For more information, please visit: FXTM