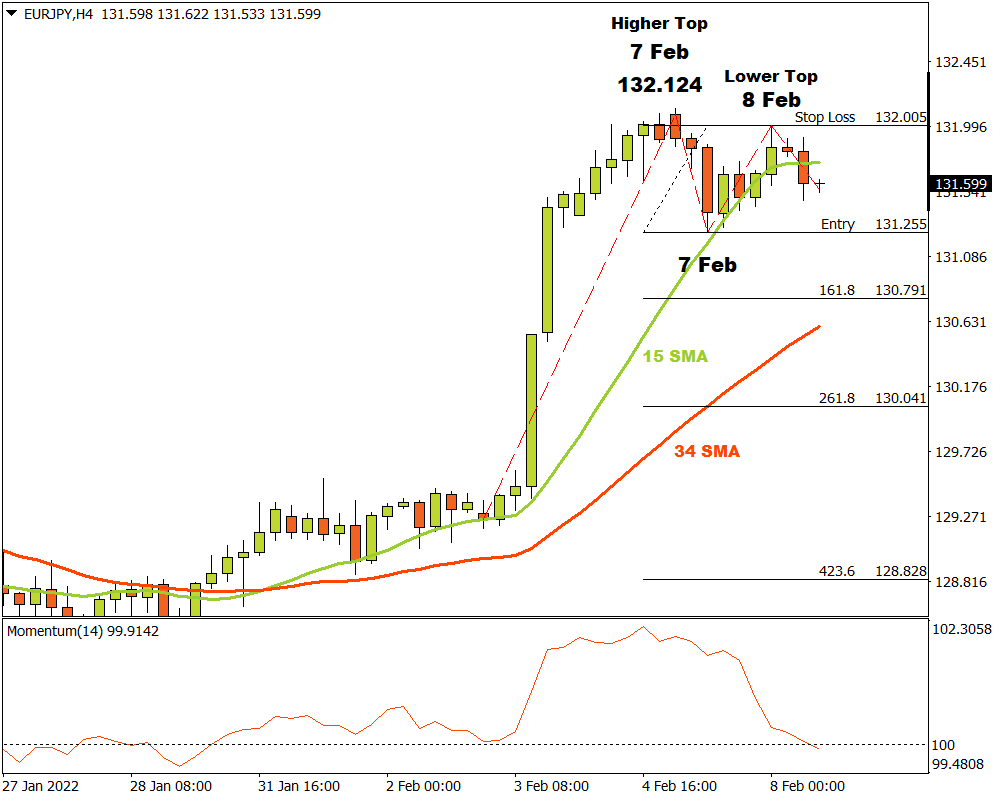
The EURJPY currency pair on the H4 time frame has been in a strong bullish trend that lasted until 7 February, when a last higher top was recorded at 132.124. The market then broke to the downside, just slicing through the 15 Simple Moving Average and the Momentum Oscillator changed direction to the supply side, both indicating a likely downward alteration in market momentum.
A possible critical support level formed when a bottom was recorded later in the same session at 131.255. Bulls then joined the market and drove prices higher, reaching a resistance level on 8 February at 132.005. Currently it looks like the bears are gathering to rejoin the market again.
If bears can gather in enough numbers too overwhelm the bulls and push prices through the critical support level at 131.255, then three possible price targets can be projected from there. Attaching the Fibonacci tool to the last bottom at 131.255, and dragging it to the resistance level at 132.005, the following targets can be calculated. The first target can be estimated at 130.791 (161.8%). The second price target may be calculated at 130.041 (261.8%) and the third and final target may be expected at 128.828 (423.6%).
EURJPY H4 Timeframe
If the resistance level at 132.005 is broken, the above scenario is must be reconsidered. As long as the market players maintain a negative sentiment and supply overcomes demand, the outlook for EURJPY currency pair on the H4 time frame will remain bearish.
For more information, please visit: FXTM