The EURJPY currency pair on the D1 time frame had upward momentum that lasted until 21 October. The bears found the price attractive at those levels and the result was that a last higher top was recorded at 148.392. A closer look at the Momentum Oscillator reveals a negative divergence between points “a” and “b” when comparing the tops at 147.190 and 147.700. This could have warned technical traders that the upward momentum was running out.
After the higher top at 148.392, the price broke through the 15 and 34 Simple Moving Averages and the Momentum Oscillator followed by breaking through the 100 baseline into bearish terrain.
A possible critical support level formed when a lower bottom was recorded on 11 November at 142.539. The bulls are currently trying to push the price higher to reclaim their lost grip on the market.
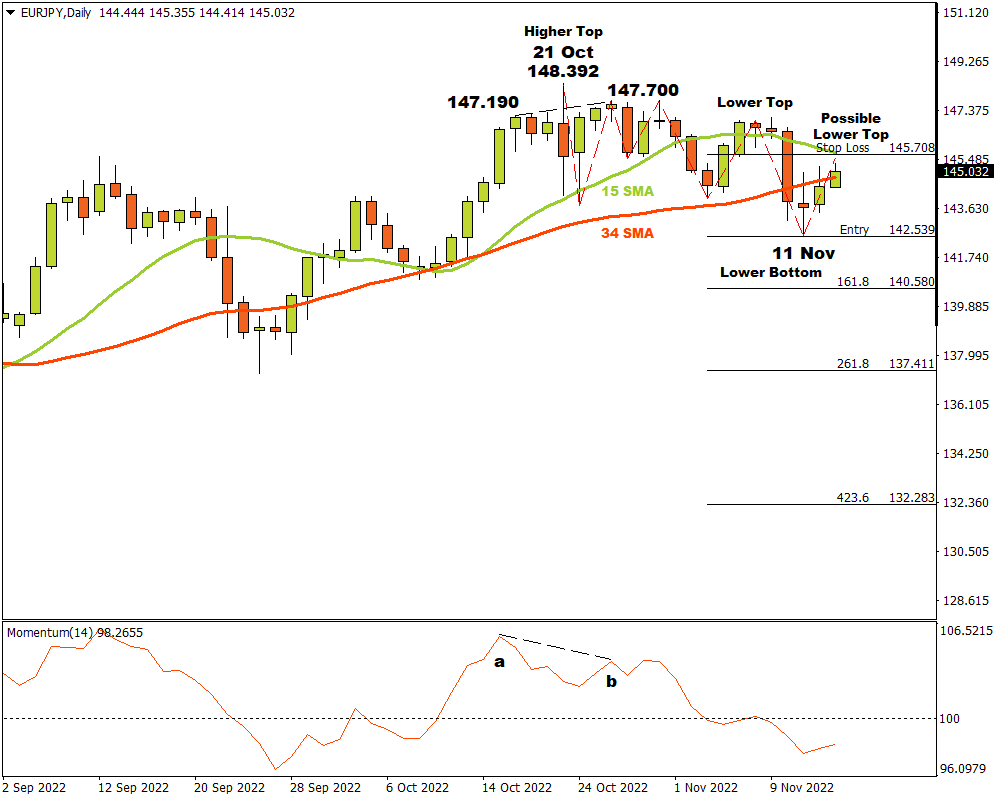
If the market breaks through the critical support level at 142.539, three possible price targets will be possible from there. Attaching the Fibonacci tool to the bottom at 142.539 and dragging it to a resistance level near the 34 Simple Moving Average at 145.708, the following targets can be calculated. The first target is estimated at 140.580 (161.8%). The second price target can be expected at 137.411 (261.8%) and the third and final target may be considered at 132.283 (423.6%).
If the resistance level at 145.708 is broken, the above scenario is not valid and must be re-considered. As long as the bears continue to cause lower top and bottoms, the outlook for the EURJPY currency pair will remain bearish.
For more information, please visit: FXTM