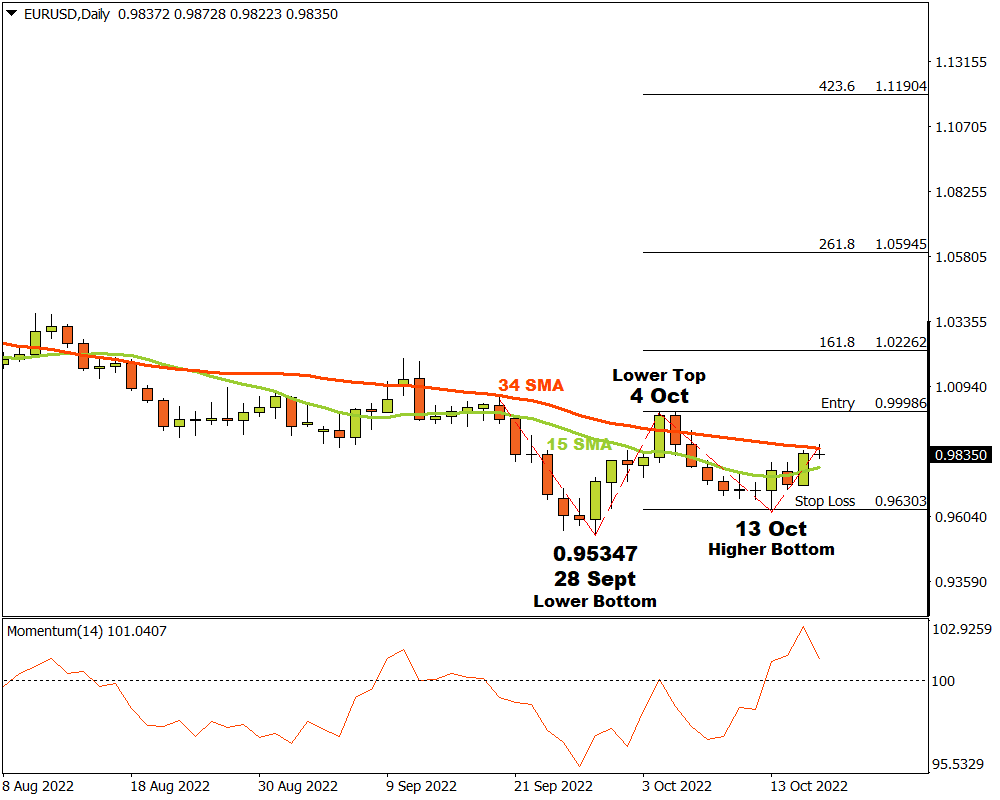
The EURUSD on the D1 time frame was in a prolonged downward trend until 28 September when a possible last lower bottom was recorded at 0.95347. Bulls found the price enticing at such levels and demand started overcoming supply. After the lower bottom at 0.95347, the price broke through the 15 and 34 Simple Moving Averages and the Momentum Oscillator shifted into the bullish territory. This could have warned technical traders that a shift in the market momentum might be on its way.
A lower top and possible critical resistance level formed on 4 October at 0.99986. The bears then desperately tried to gain the upper hand again but a higher bottom formed at a support level on 13 October at 0.96303 as the bulls started edging their way upwards again.
If the EURUSD manages to break through the critical resistance level at 0.99986, then three possible price targets can be calculated from there. Applying the Fibonacci tool to the lower top at 0.99986 and dragging it to the higher bottom at the support area near 0.96303, the following targets can be considered. The first target might be likely at 1.02262 (161%), with the second price target possible at 1.05945 (261.8%). The third and final target may be expected at 1.11904 (423.6%).
If the 0.96303 support level is broken, the possible bullish scenario is not valid anymore and the whole scenario must be re-evaluated. As long as market structure continues to makes higher tops and bottoms, the outlook for the EURUSD on the D1 time frame will remain bullish.
For more information, please visit: FXTM