International financial market is a complex inconstant mechanism. Just like a human being, it lives a life full of events. People try to analyze, predict and control it using a diverse range of instruments, brokers’ software and even intuition. Experienced traders create programs that are always close at hand like a reliable rear. They are bars or charts; each of them is unique.
Most popular methods of FX analysis
There are several methods to examine the stock market:
- point and figure;
- Wyckoff eyes;
- Kagi charts;
- Renco charts;
- Bullseye trading system with additional software;
- candlestick charts;
- Dukascopy charts.
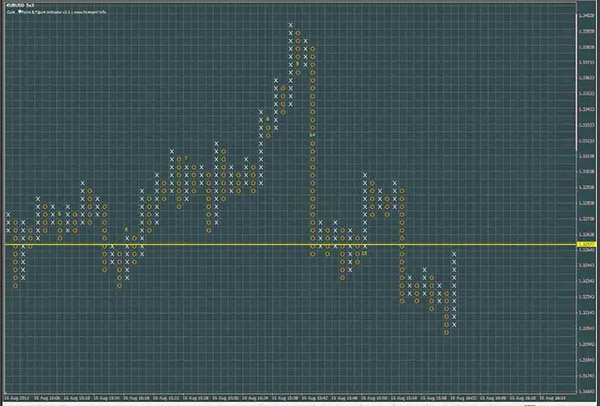
Graphical methods are pretty clear and easy to read, that is why many traders choose them in their work. One of the most popular is Forex point and figure software. It helps to filter out market noise and false Forex movements. Thanks to that, a trader can easily lead his strategy without drawing his attention from constant changes in price.
Advantages of point and figure method
- simplicity in defining the level of support and resistance;
- reveal of the moment when a trend starts its way;
- autonomy of price dynamics (there is no need to use additional indicators for interpreting signals);
- independency from computers (a trader can use point and figure charts in a handwriting way);
- independency from the time factor (if there are some price movements in the market, the chart is active, when the price is more or less the same, then passive);
- suitability for beginners as well as advanced users.
To program or install forex point and figure charting software, a trader should define the following parameters:
- box size (for example, if price goes a set amount of 10 points, an X appears, i.e. box size = 10. If a box size is set as 20 points, then an X will appear when the price goes 20 points.)
- reversal (this parameter is responsible for changes in trends).
The main peculiarity of p&f charts, explained in different resources, is that it is completely time-independent. But it is the reason, why many instruments do not work with this system.
What a trader needs to tune up p&f functions
- When traders speak about point and figure chart, MT4 is better to be installed.
- Only a minute-time-table is necessary.
- Choice of an instrument (a currency pair and so on).
- Closing and opening quotations from archives.
- Setting 40 thousands of bars.
- Downloading templates for the indicator.
- Adjustment of vertical and horizontal lines.
- Fixation of scale.
Interpretation - Basics
- “X” stands for a price increase, so “0” means a decline in prices.
- A “dot” is there to show the start of changes.
- 1 point is the minimal step of price (i.e. a chart registers changes only when fluctuation is more then 1 point).
- Points always alternate with figures.
Interpretation - Main Signals
There is no particular difficulty in how to read point and figure charts.
|
Signal |
Name |
Meaning |
|
S1 |
Simple sell |
It is formed from 3 columns 0 – X – 0, when the second column of “0” falls on 1 cell lower than the previous “0”. |
|
B1 |
Simple buy |
It is formed from 3 columns X – 0 – X, when the second of “X” goes up on one cell in comparison with the previous “X”. |
|
S2 |
Simple sell with falling top |
It is formed from 4 columns X – 0 – X – 0 and is similar to S1 by its ending, but the top of the second “X” is on one cell lower than the previous “X”. |
|
B2 |
Simple buy with growing bottom |
It is formed from 4 columns 0 – X – 0 – X and is similar to B2 by its ending, but the second “0” column’s base is one cell higher than the previous “0”. |
|
S3 |
Break through a triple bottom |
The current “0” column is one cell lower than two previous “0”s, the tops are of no importance. |
|
B3 |
Break through a triple top |
Tops of two previous “X” columns are at the same level, but the top of the third “X” breaks through on 1 cell up. |
|
S4 |
Falling triple bottom |
2 successive S1 and / or S2, and as a consequence may be an evidence of the bearish trend. |
|
B4 |
Growing triple top |
2 successive patterns B1 and / or B2 that make a chain of ascending tops. |
|
S5 |
Divergence of triple bottom |
Alike S3, but before the current “0” breaks through the horizontal level of support, the bottom of the third “0” goes one cell up. |
|
B5 |
Divergence of triple top |
Alike B3, but the third “X” column goes one cell down before the forth “X” breaks though the horizontal resistance. |
To sum up, point & figure charts, free from time, is a really good assistance in Forex trading, though they also have their disadvantages. But if a trader uses several methods, p&f should be definitely among them.