Choosing the right currency pair for efficient trading
Practice shows that most novice traders are limiting themselves to the pair EUR/USD. In fact, this financial instrument has a number of negative features:
- EUR/USD charts are hardly subject to computer analysis, which makes the use of indicators impractical;
- this pair has a greater number of false breakdowns even when working with timeframes from H1 and higher;
- The specification of the contracts of most brokers does not imply a positive swap when transferring the transaction on this instrument to the next day;
- Price Action patterns and the use of graphic models are justified in 60% of cases, which puts the effectiveness of these methods into question.
Why, in this case, beginner traders prefer EUR/USD when choosing a currency pair? This can be explained by the human factor. EUR and USD currencies are practically on everyone’s lips and this creates a kind of illusion of reliability. In addition, EUR/USD has the lowest market spread, which in the period of moderate liquidity ranges from 0 to 0.7 points. These factors are mistakenly perceived by novice bidders as decisive when choosing a tool for earnings. It is not surprising that most traders lose their investment during the first month of practice. To avoid this, it is recommended to pay attention to other trend currency pairs, work with which can really meet expectations.
AUD/USD
This tool can rightly be considered the most optimal for novice traders for the following reasons:
- Moderate intra-day volatility, which rarely exceeds 50 points;
- On long-term timeframes, pronounced trends are often observed, which creates all the conditions for the effective application of technical analysis;
- Moderate spread;
- Pronounced local levels, which allows you to successfully implement strategies for trading pending orders;
- Correct work of standard and custom indicators on periods from H1 and more;
- The likelihood of intense price momentum during trading hours is minimal, since the peak of the activity of Australian traders falls on the Asian session.
From all the above, it is logical to assume that for successful trading on the AUD/USD pair, the application of classical technical analysis is effective:
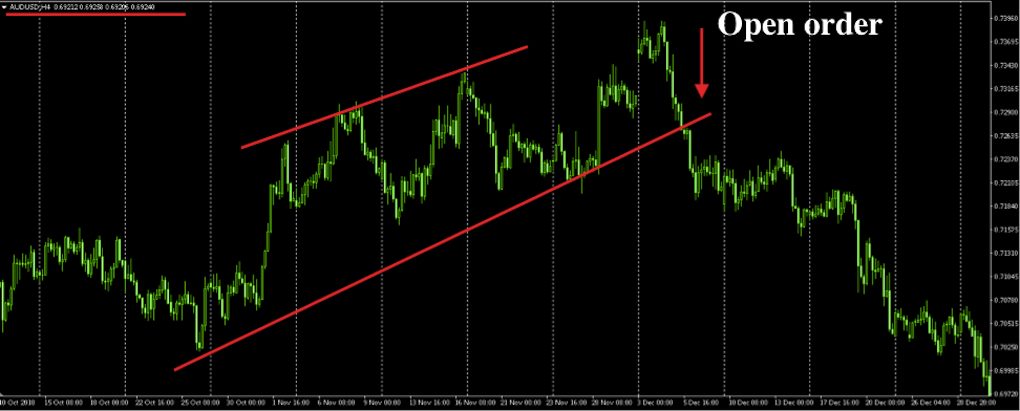
The screenshot shows a segment of the chart of this financial instrument with a period of H4. A clear formation of local levels allows you to correctly hold the line of support and resistance, on the basis of which to draw up a medium-term trading plan. At the same time, novice traders will not need to use additional analytical tools.
It is worth saying that the use of the popular Sniper strategy is recommended precisely on the AUD/USD pair due to the characteristic features of this asset.
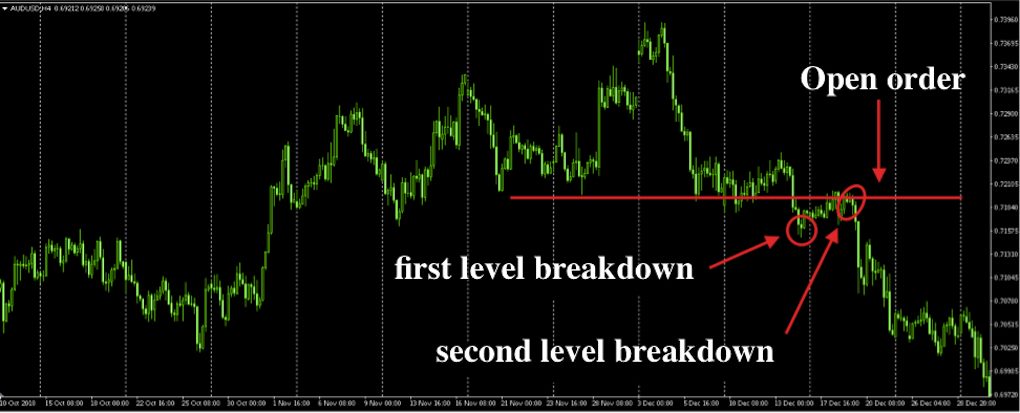
The graph has 3 local minima at the same level, along which the support line should be drawn. In accordance with the rules of the Sniper strategy, the entry into the market should not be carried out after the breakdown of the trend line, but after fixing the price outside of it. An example of a correctly opened order is shown in the screenshot. After the initial breakdown, it is important to wait for the graph to touch the level previously set, and open a deal at the current price immediately after the rebound from it.
USD/JPY
This currency pair scares many novice traders with its price impulses, each of which can be up to 100% of the average value of daily volatility. In addition, the use of computer analysis on a pair of USD/JPY never leads to predictable results in the long term. Despite this, this tool should be considered for beginners and traders with an average level of proficiency. In fact, it is this pair that Fibonacci levels work best, with the correct grid structure.
For successful trading USD/JPY, you should stretch the Fibonacci grid at the beginning of the formation of a new trend or a long correction. An important condition: the first local level should correspond to the value of 61.8 Fibonacci.
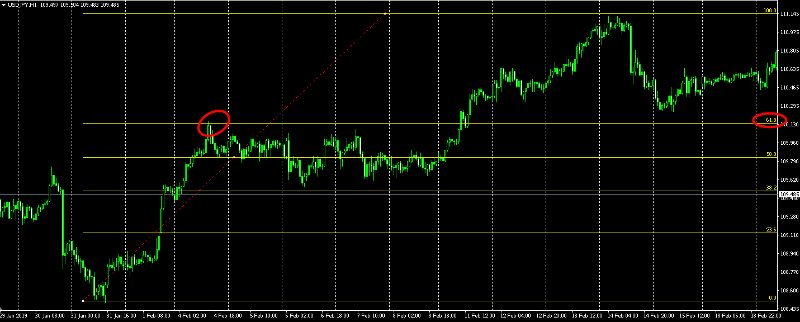
The screenshot shows a segment of the USD/JPY chart with a period of H1. After a long downtrend, the direction of movement of the graph has reversed. After the formation of the first local maximum, the Fibonacci grid should be built. Line 61.8 should pass on the new level. Next, the trading plan is built as follows:
- When the price breaks through the level of 38.2, a Sell order should be opened at the current price with a target value corresponding to the level of 0.0.
- If the formation of a new trend continues and the price overcomes the level of 61.8, you will need to open a Buy order with a target value of 100.0.
The potential profit from the use of this tactic will be about 50-80 points. The placing of the Stop loss safety order is mandatory at the levels of 38.2 and 61.8, depending on the direction of the transaction. It is worth saying that the accuracy of the signals reaches 80%, which was repeatedly tested by personal experience.
EUR/JPY
Beginners practically do not trade EUR/JPY. It should be said that the effectiveness of the technical or computer analysis on the EUR/JPY pair is indeed extremely doubtful, however, rare graphic models that are practically not formed on the more well-known tools are quite common on this tool. For timely and accurate identification of patterns, it is recommended to analyze the chart with the period H4.
On the EUR/JPY pair, the flag graphic pattern most often occurs. It is easy enough to reveal on the chart even to beginner traders with basic knowledge of technical analysis:
The “Flag” pattern consists of two elements:
- Price momentum in the direction of the new trend.
- Long-term correction, during which at least 2 distinct local levels are formed.
The main advantage of using this pattern in trading is the well-known target level for fixing profits, which is equal to the range of the first price impulse. When forming a “bullish flag” on the chart, only the opening of a Buy order should be considered after the price breaks through the resistance level. Stop Loss is set at the last local minimum correction.
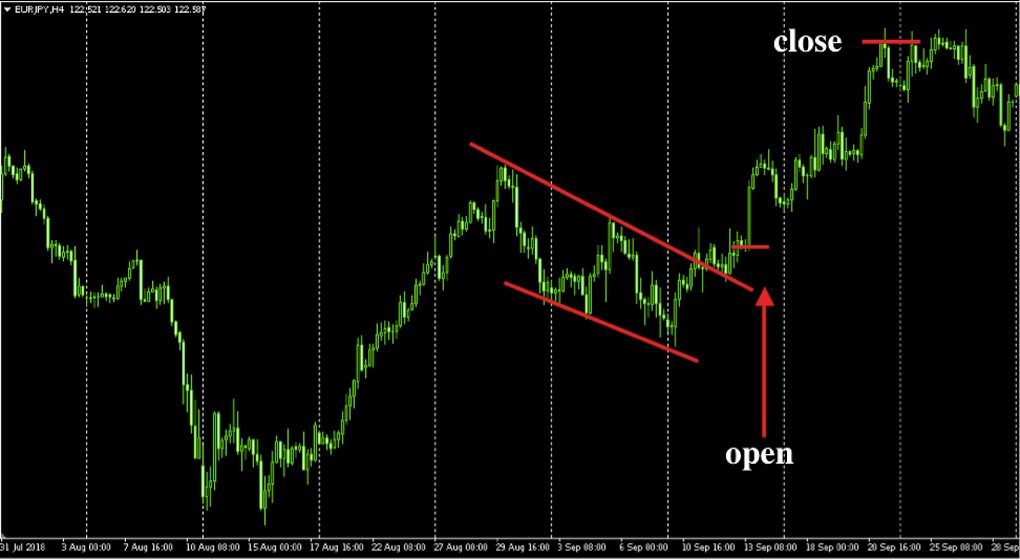
To understand the principle of the practical application of the “Flag” pattern, it is recommended to pay attention to another example:
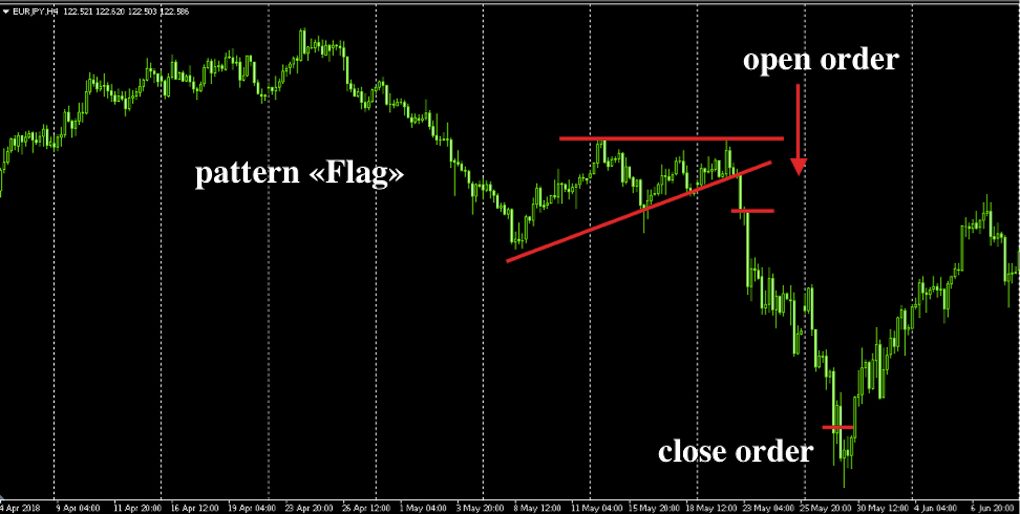
The screenshot shows a segment of the EUR/JPY pair with a period of H4, on which the bear flag pattern is formed. A Sell order is opened after the price has overcome the support level. The Take Profit value corresponds to the range of the first price impulse in the direction of the new trend. The screenshot shows entry and exit points from the market. Profit exceeded 100 points. According to my own observations, I can say that with the EUR/JPY pair, the considered pattern is formed at least 2 times a month, which indicates an approximate profit potential of 10-20%.
Attention! Despite the fact that the “Flag” pattern has worked out in 80% of cases, it is strongly recommended to follow the rules of money management when trading. The risk per transaction should not exceed 5% of the deposit.
EUR/USD
At the beginning of the article, some characteristic features of this tool were considered, after getting acquainted with which the desire to open orders for this pair should be reduced to a minimum. Nevertheless, there is a strategy, the use of which is justified on EUR/USD. It is about the TS "Start".
The essence of the method is to open a deal in the direction of the breakdown of the first M30 candle of the European trading session. The logic is that the first half of the day is decisive for traders in the United Kingdom and the price overcoming the Open or Clouse levels of the first M30 candle (7-00 GMT) determines the potential trend direction before the start of the US trading session. It is important to note that the range of breakdown must be at least 7 points.
Trading Rules for TS “Beginning”
To open a Buy order, it is important to wait for the candlestick formed at 07-00 GMT on the chart with the M30 period in the upstream direction. Stop Loss is set at the opposite value of the signal price element. To open a Sell order, the rules are mirrored.
Important! In descriptions of the Start strategy, which can be found on many thematic sites, it is recommended not to place an order for automatic profit fixation. According to the advice of the authors, the transaction should be closed at the market value at 13-00 GMT (the beginning of trading on the US stock market). In fact, it is not very effective. It is more expedient to consider the fixed value of the take profit order at the level of 10-12 points. Trading this strategy during the publication of important macroeconomic data for EUR or GBP is not recommended.
To assess the effectiveness and to understand the principles of applying the “Start” strategy on the EUR/USD pair, with the adjustments mentioned earlier, it is recommended to pay attention to several examples:
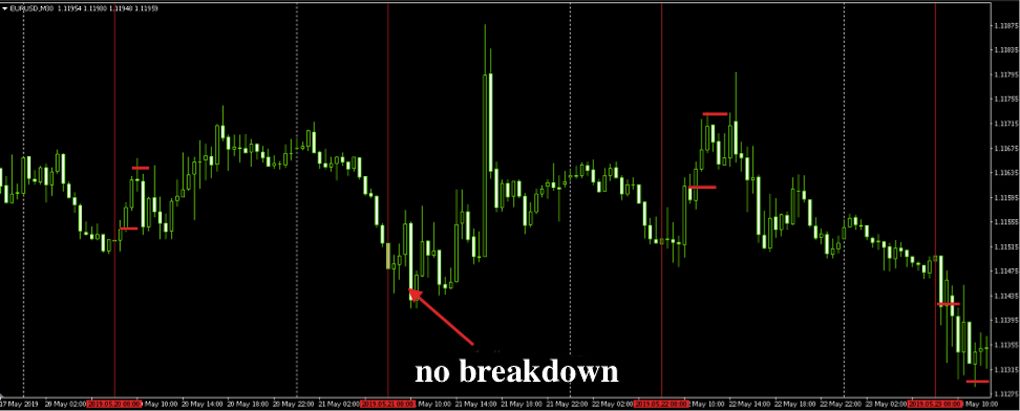
The graph shown in the screenshot covers 4 European sessions. During this period, 3 entry signals to the market were formed, each of which turned out to be profitable. Order opening and closing points are marked with a red marker on the chart. Profit for each transaction amounted to 10 points, taking into account the spread.
Important! Entering the market according to the rules of the TS “Beginning” is possible if the potential profit is identical to the potential losses.
Conclusion
As you can see, the trading opportunities of the over-the-counter foreign exchange market are not limited to the EUR/USD pair. There are enough financial instruments, the characteristic features of which will allow even a novice trader to achieve the desired result:
- For the AUD/USD pair, classical technical analysis and the Sniper strategy are most effective.
- When trading EUR/USD, it is not recommended to use pending orders and tools for computer analysis. Instead, you should pay attention to trading on the Price Action system on charts with a period from H4 and more, or to the use of TS “Beginning” with minor modifications.
- The USD/JPY pair is perfect for analysis using Fibonacci levels, but only if you stretch the grid in accordance with the recommendations presented in the article.
- When working with EUR/JPY, attention should be paid to the formation of graphic patterns on the H4 charts and, in particular, the Flag model. Considered in the material of trade tactics may be used in conjunction with the main strategy. The main thing is to comply with the rules of risk management.
In fact, all the trading methods discussed in the article can be applied comprehensively, which will allow achieving stable and high rates of return.