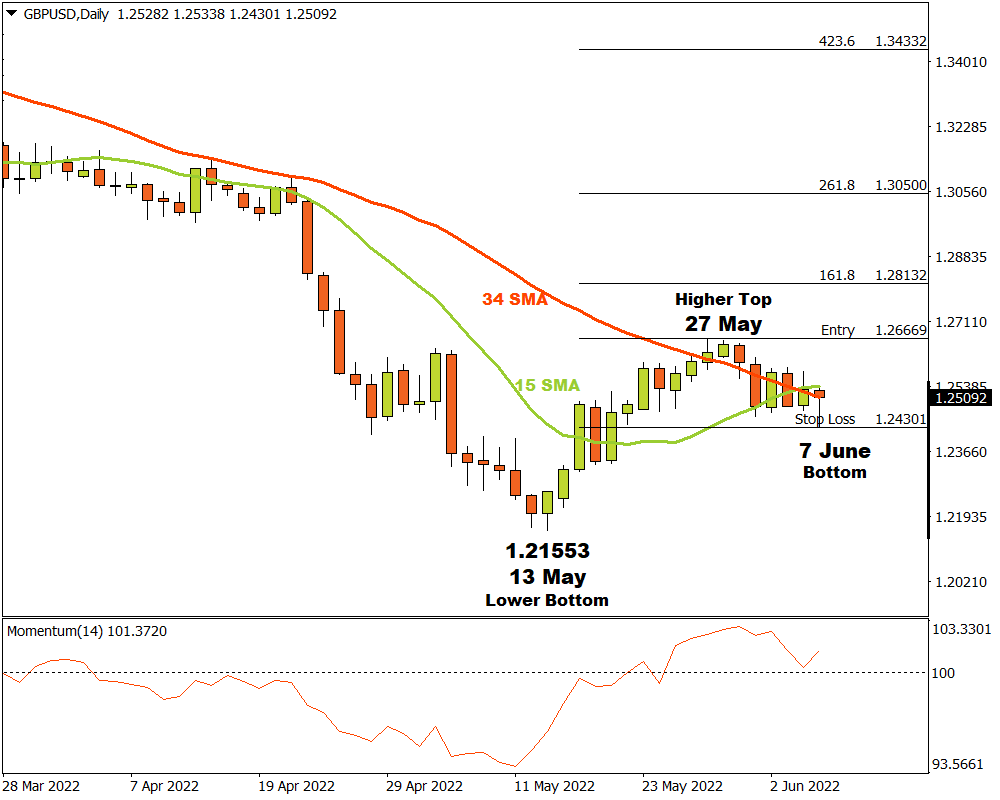
The GBPUSD on the D1 time frame was in an extended bearish trend until 13 May when a last lower bottom was recorded at 1.21553. Bulls found the price attractive at those levels and demand started overcoming supply. After the lower bottom at 1.21553, the GBPUSD broke through the 15 and 34 Simple Moving Averages and the Momentum Oscillator pierced the 100 baseline into bullish terrain.
A higher top and possible critical resistance level formed on 27 May at 1.26669. Bears are currently trying to grab hold of the market again but a possible bottom might be forming at a support level on 7 June at 1.24301.
If the support level holds and the GBPUSD manages to break through the critical resistance level at 1.26669, then three possible price targets can be calculated from there. Applying the Fibonacci tool to the higher top at 1.26669 and dragging it to the bottom of the support area at 1.24301, the following targets might be considered. The first target may be likely at 1.28132 (161%) and the second price target at 1.30500 (261.8%). The third and final target may be expected at 1.34332 (423.6%).
If the 1.24301 support level is broken, the bullish scenario is invalidated and the scenario needs to be re-assessed. As long as the market maintains a positive sentiment and demand overwhelms supply, the outlook for the GBPUSD on the D1 time frame will remain bullish.
For more information, please visit: FXTM