GBPUSD on the H4 time frame had an extended downtrend until a last lower bottom was reached on 14 July at 1.17590. A closer look at the Momentum Oscillator reveals positive divergence between point “a” and “b” when comparing the bottoms at 1.18262 and 1.17590. This could have alerted technical traders that the down trend was losing momentum.
After the lower bottom at 1.17590, the bulls started coming out of their long hibernation and the price broke through the 15 and 34 Simple Moving Averages. The Momentum Oscillator also confirmed the change in energy by piercing the 100 base line into bullish territory.
A higher top formed at a critical resistance level on 18 July at 1.20324 and the bears dug deep to try and get the upperhand again. A support level stopped them however at 1.19234 on 19 July with a higher bottom forming.
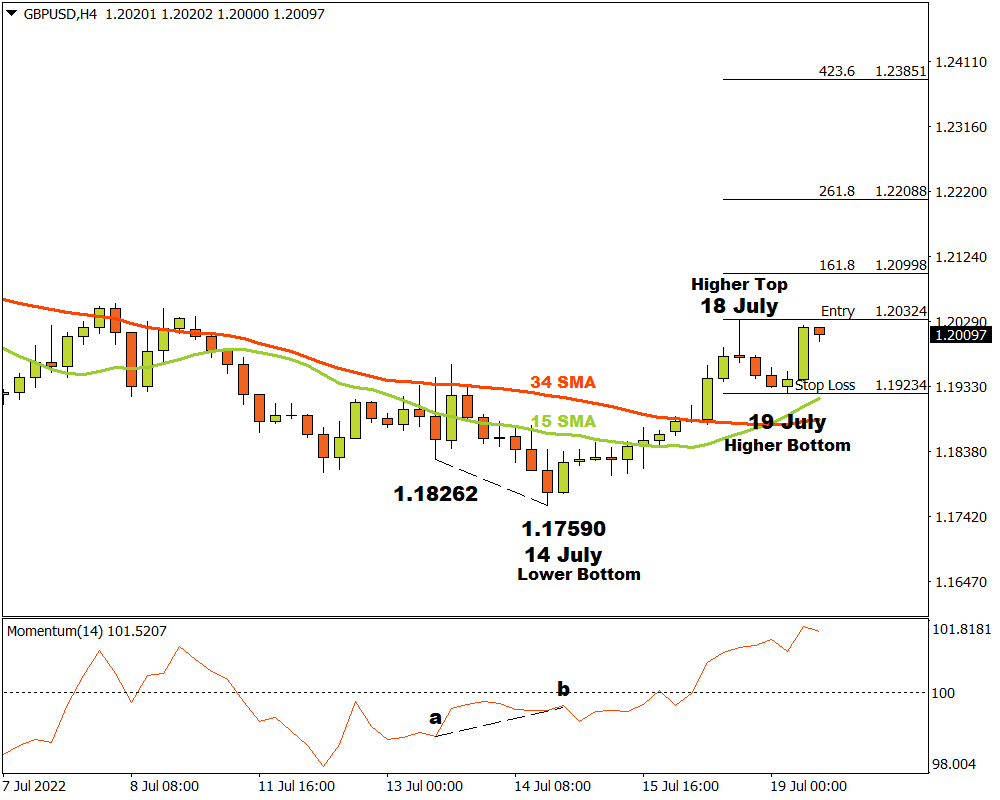
If the GBPUSD currency pair manages to break through the critical resistance level at 1.20324, then three possible price targets may be considered from there. Attaching the Fibonacci tool to the higher top at 1.20324 and dragging it to the bottom of the support level at 1.19234, the following targets can be calculated. The first target may be estimated at 1.20998 (161.8%). The second price target could be at 1.22088 (261.8%) and the third and final target might be anticipated at 1.23851 (423.6%).
If the support level at 1.19234 is broken, the above scenario is invalid. As long as demand overcomes supply, the outlook for GBPUSD on the H4 time frame will remain bullish.
For more information, please visit: FXTM