NZDUSD on the D1 time-frame was in an extended uptrend until 18 September when a higher top was recorded at 0.67962. Supply pressure then toppled the bulls and the market started moving lower.
After the higher top at 0.67962, the market broke through the 15 and 34 Simple Moving Averages, the Momentum Oscillator crossed into negative terrain as it pierced through the zero baseline, and a Bearish Japanese Candlestick formation called Three Black Crows was formed. All three technical indicators confirmed that the bears have exerted pressure and this resulted in the start of a likely new downtrend.
A possible critical support level was formed on 24 September at 0.65099 after which the bulls started pushing back and they have since been trying to drive the Kiwi higher.
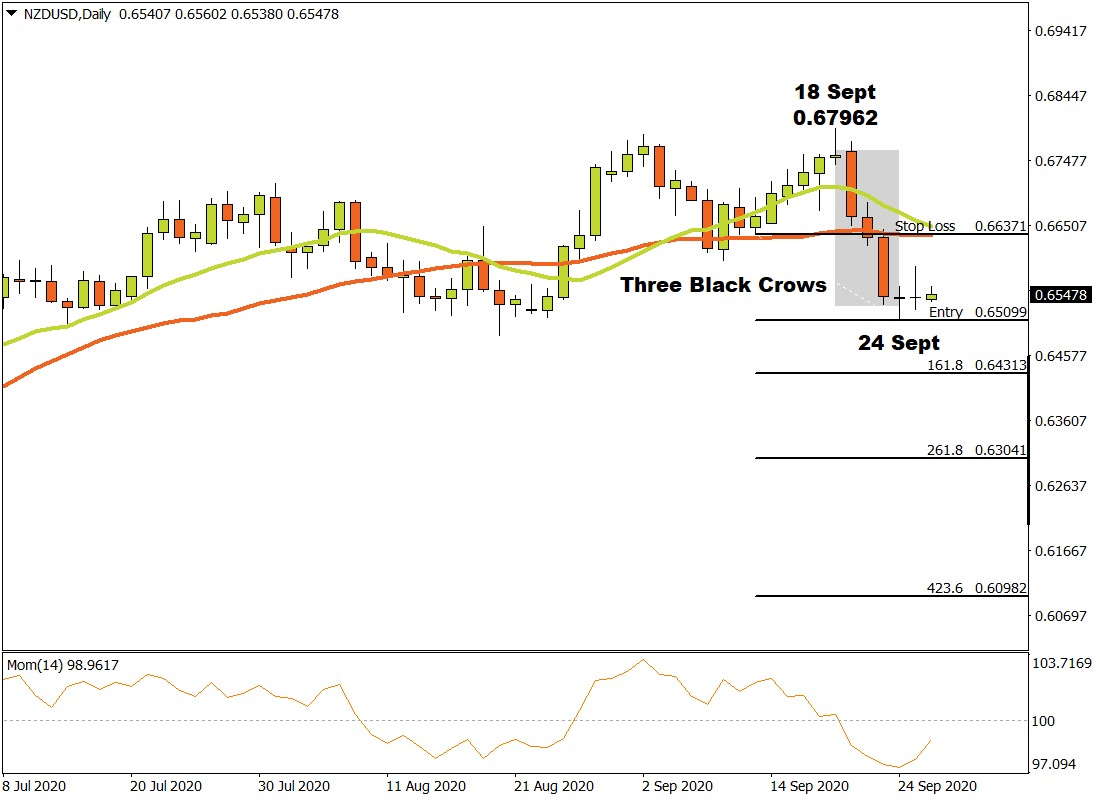
In the event that the NZDUSD pair breaks through the critical support level at 0.65099, three possible price targets may be calculated from there. Applying the Fibonacci tool to the bottom of the support level at 0.65099 and dragging it to a possible resistance level near the 34 Simple Moving Average at 0.66371, the following targets may be considered. The first target can be projected at 0.64313 (161 %). The second price target may be predicted at 0.63041 (261.8%) and the third and final target may be expected at 0.60982 (423.6%).
If the resistance level at 0.66371 is broken, the above scenarios are annulled and appropriate action must be taken.
As long as sellers maintain a negative sentiment and supply keeps overwhelming demand, the outlook for the Kiwi on the Daily time-frame will remain bearish.