The Loonie on the H4 time frame was in a bearish trend until 3 March when a lower bottom was reached at 1.25861. Bulls found the price attractive and demand started overcoming supply. A closer look at the Momentum Oscillator revealed a positive divergence between point “a” and “b”, compared to the price at 1.26641 and 1.25861. This could have alerted technical traders that a potential momentum change was on the cards.
After the lower bottom at 1.25861, the Loonie broke through the 15 and 34 Simple Moving Averages and the Momentum Oscillator crossed the zero baseline into bullish territory, confirming that the bulls were on the march.
A higher top and possible critical resistance level formed on 4 March at 1.27908 and bears then tried to overpower the bulls but could not prevail and a higher bottom formed on 7 March at 1.26840.
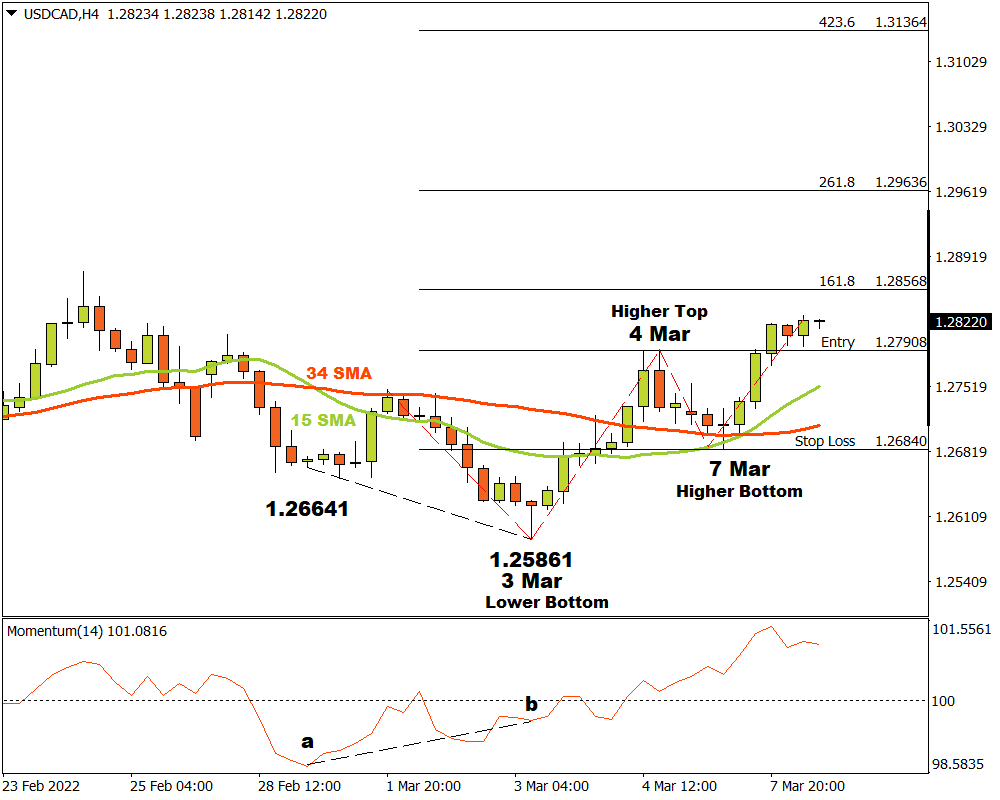
Later in the same session the Loonie broke through the critical resistance level at 1.27908 and three possible price targets was calculated from there. Applying the Fibonacci tool to the top of the resistance level at 1.27908 and dragging it to the bottom of the support area near the 15 Simple Moving Average at 1.26840, the following targets was considered. The first target was projected at 1.28568 (161%) and the second price target at 1.29636 (261.8%). The third and final target can be expected at 1.31364 (423.6%) if the uptrend continues.
If the 1.26840 support level is reached, the bullish scenario is invalidated and the situation needs to be re-assessed. As long as the market maintains a positive sentiment and demand overwhelms supply, the outlook for the Loonie on the H4 time frame will remain bullish.
For more information, please visit: FXTM