The USDCAD on the H4 time frame was in an uptrend that made a higher top at 1.32079 on 1 September. Supply overcame demand and the price structure started changing. After the top at 1.32079 the price broke through the 15 and 34 Simple Moving Averages (SMA) and the Momentum Oscillator changed direction to the lower side, both confirming a likely change in market direction.
A possible critical support level formed when a bottom was recorded at 1.30747 on 2 September. Bulls then pushed the market up and a lower top formed on 5 September at 1.31735.
If the bears continue to make their influence felt and manage to break through the critical support level at 1.30747, then three possible price targets can be projected from there. Attaching the Fibonacci tool to the bottom at 1.30747, and dragging it to the lower top at 1.31735, the following targets may be calculated. The first target can be estimated at 1.30136 (161.8%). The second price target may be calculated at 1.29148 (261.8%) and the third and final target might be expected at 1.27550 (423.6%).
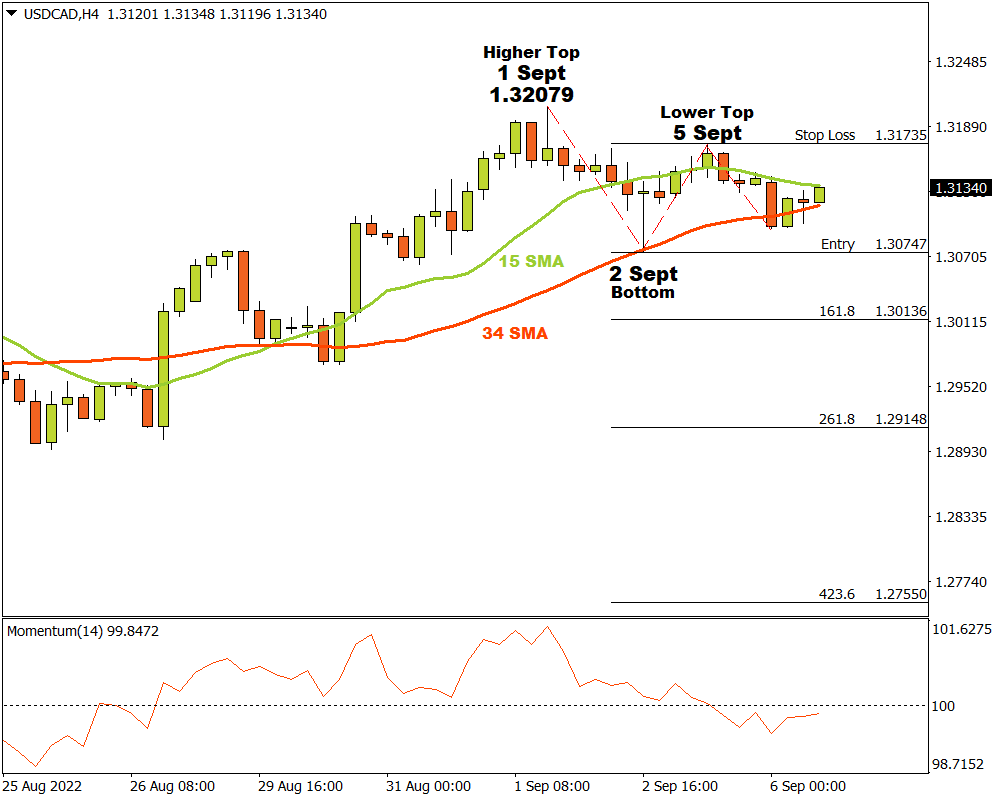
If the resistance level at 1.31735 is broken, the above scenario is void and must be re-viewed. As long as the bears exert their influence, the outlook for USDCAD on the H4 time frame will remain to the down side.
For more information, please visit: FXTM