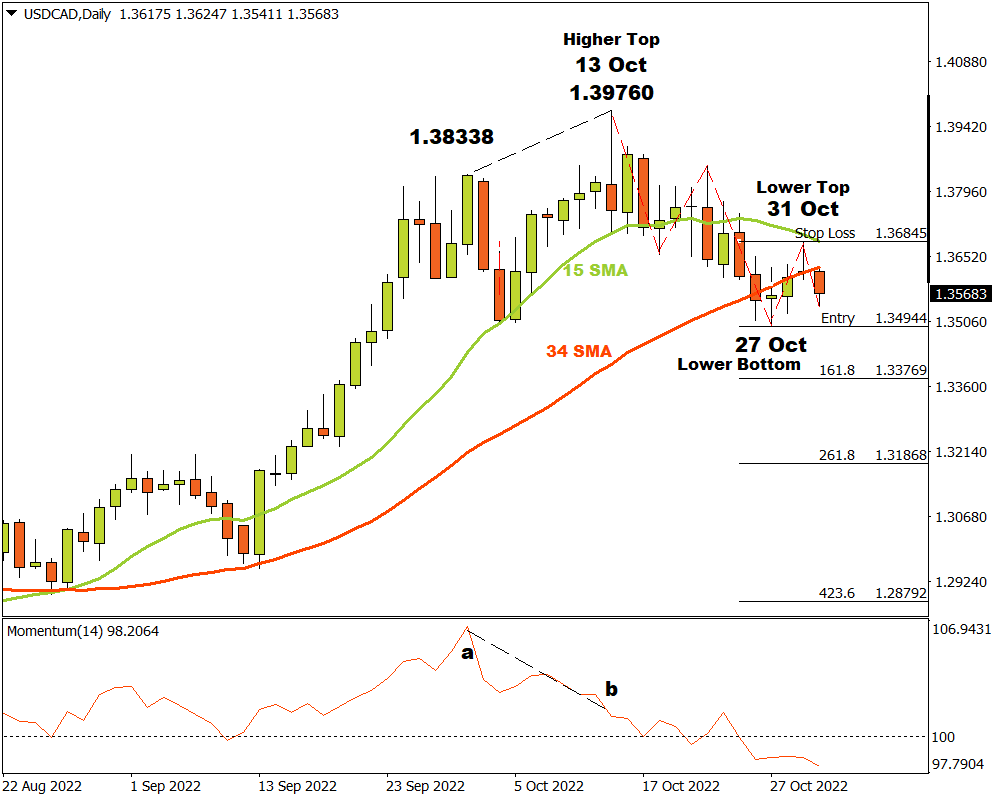
The USDCAD currency pair on the D1 time frame was in an uptrend that lasted until 13 October after which a last higher top was recorded at 1.39760. A closer look at the Momentum Oscillator reveals a negative divergence between points “a” and “b” when comparing the tops at 1.38338 and 1.39760. This could have alerted technical traders that the bullish momentum was fading.
After the higher top at 1.39760, the price broke through the 15 and 34 Simple Moving Averages and the Momentum Oscillator followed suite by slicing through the 100 baseline into bearish regions. A possible critical support level formed when a bottom was recorded on 27 October at 1.34944. The bulls were not satisfied with that sort of thing and tried to drive the price higher, forming a lower top in the process at 1.36845.
If the bears are able to break through the critical support level at 1.34944, three possible price targets will be possible from there. Attaching the Fibonacci tool to the bottom at 1.34944 and dragging it to the resistance level at 1.36845, the following targets may be calculated. The first target is estimated at 1.33769 (161.8%). The second price target can be expected at 1.31868 (261.8%) and the third and final target may be considered at 1.28792 (423.6%).
If the resistance level at 1.36845 is broken, the above scenario is not valid anymore and must be re-assessed. As long as the bears continue their drive and support can overwhelm demand, the outlook for the USDCAD currency pair will remain bearish.
For more information, please visit: FXTM