The USDCAD currency pair on the H4 time frame had a short downtrend until 24 November when a last lower bottom was recorded at 1.33156. Bulls found the price attractive at those levels and the bullish momentum in the market started rising. A closer look at the Momentum Oscillator reveals positive divergence between points “a” and “b” when comparing the bottoms at 1.33272 and 1.33156. This could have alerted technical traders that the short downtrend might be losing steam.
After the lower bottom at 1.33156, the price of Crude Oil broke through the 15 and 34 Simple Moving Averages and the Momentum Oscillator sliced through the 100 base-line into bullish terrain.
A higher top and possible critical resistance level formed on 28 November at 1.35039. The bears then tried to pull prices lower but a possible bottom might realize after the price bounced on a support level on 29 November at 1.34076. If the market breaks through the critical resistance level at 1.35039, then three possible price targets can be calculated from there. Applying the Fibonacci tool to the higher top at 1.35039 and dragging it to the bottom of the support area at 1.34076, the following targets may be considered. The first target may be likely at 1.35634 (161%) and the second price target at 1.36597 (261.8%). The third and final target may be expected at 1.38155 (423.6%).
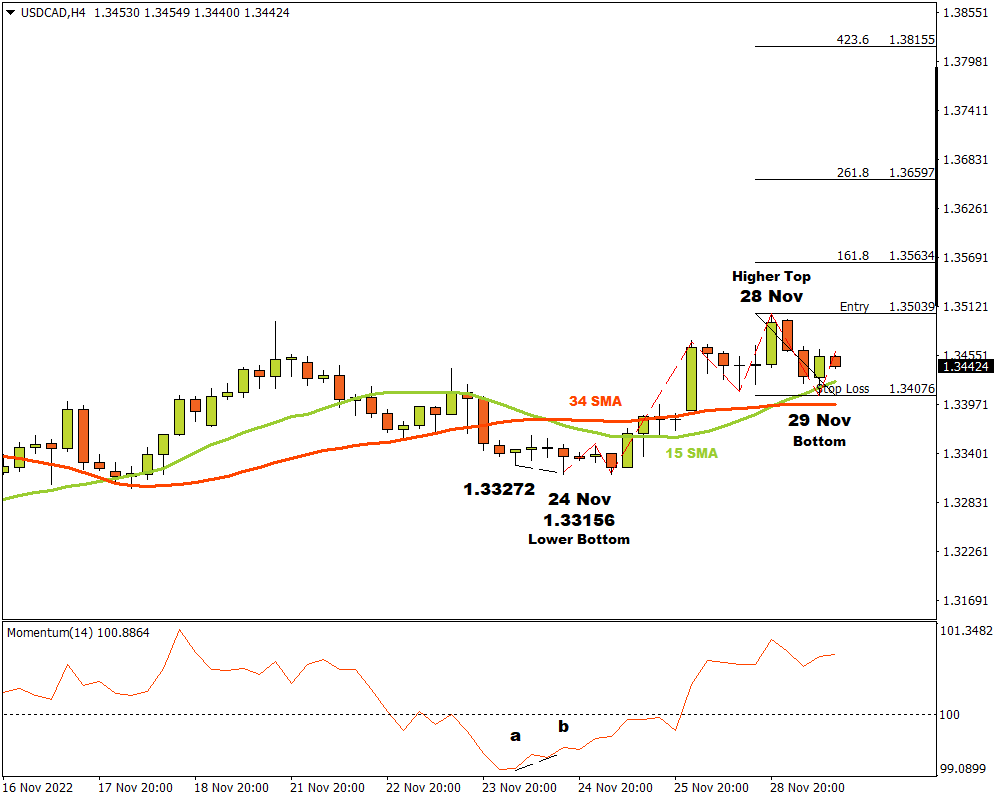
If the support level at 1.34076 is broken, the upbeat scenario is overturned and must be re-evaluated. As long as the bulls can sustain the upward momentum, the outlook for the USDCAD currency pair on the H4 time frame will remain bullish.
For more information, please visit: FXTM