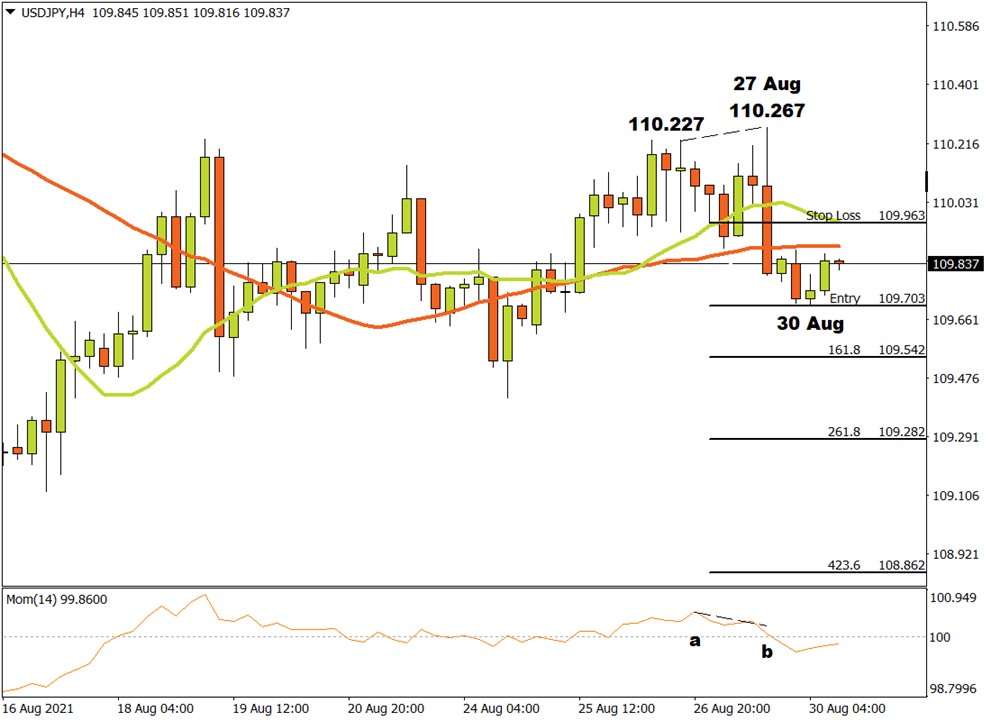
The Gopher on the H4 time frame was in a brief uptrend until 27 August when a last higher top was recorded at 110.267. A closer look at the Momentum Oscillator reveals a negative divergence between point a and b when comparing the higher tops at 110.227 and 110.267. This could have alerted technical traders that the market was losing momentum. The market then broke through the 15 and 34 Simple Moving Averages and the Momentum Oscillator pierced through the zero baseline into bearish territory.
A possible critical support level was formed when a bottom was recorded on 30 August at 109.703. Currently bulls are trying take control of the market again and are driving the price higher.
If the Gopher breaks through the critical support level at 109.703, then three possible price targets can be projected from there. Attaching the Fibonacci tool to the bottom at 109.703 and dragging it to the top of a resistance level near the 15 Simple Moving Average at 110.963, the following targets may be calculated. The first target can be estimated at 109.542 (161.8%). The second price target might be calculation at 109.282 (261.8%) and the third and final target can be anticipated at 108.862 (423.6%).
If the resistance level at 110.963 is broken, the above scenario is invalidated and must be reviewed. However, as long as enough bears keep pulling their weight on the Gopher, the down trend should keep gaining momentum.