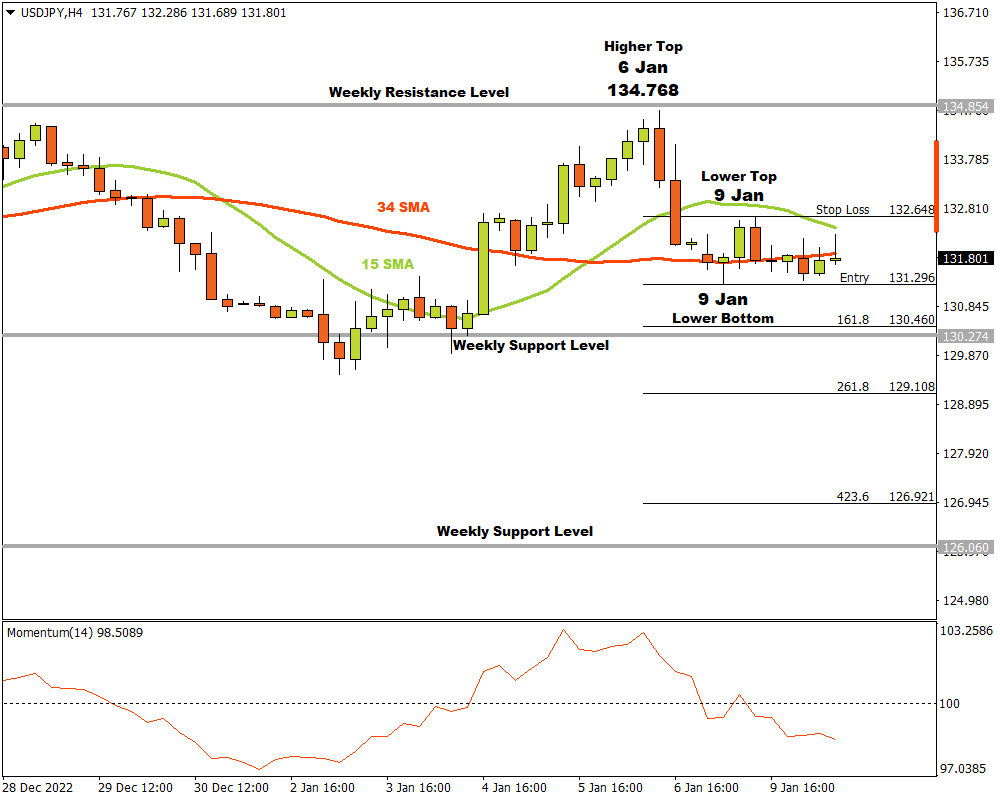
The USDJPY (nicknamed the "ninja") currency pair on the H4 time frame was in an uptrend until a last higher top formed at 134.768 on 6 January, close to a weekly resistance level. Supply then started overcoming demand with the resulting change in market momentum. After the higher top at 134.768, the price smashed through the 15 and 34 Simple Moving Averages and the Momentum Oscillator broke through the 100 baseline into bearish terrain.
A possible critical support level formed when a lower bottom was recorded on 9 January at 131.296. The bulls drove the price higher but encountered resistance and a lower top formed later in the same session at 132.648.
If the Yen breaks through the critical support level at 131.296, three possible price targets could be reached from there. Attaching the Fibonacci tool to the lower bottom at 131.296 and dragging it to the resistance level at 132.648, the following targets can be calculated. The first target may be estimated at 130.460 (161.8%). The second price target might be expected at 129.108 (261.8%) and the price will have to break through a weekly support level to reach that. The third and final target might be estimated at 126.921 (423.6%), which is well situated just off the next weekly support level.
If the resistance level at 132.648 is broken, the current situation must be re-evaluated. As long as the bears maintain their overall market momentum, the outlook for the “ninja” currency pair should remain bearish.
For more information, please visit: FXTM