The USDJPY currency pair on the H4 time frame had strong upward momentum until a year-to-date higher top formed at 137.098 on 2 March. The bears found the price appealing from there and supply started overcoming demand. After the higher top at 137.098, the price fell through the 15 and 34 Simple Moving Averages and the Momentum Oscillator broke past the 100 baseline into bearish ground.
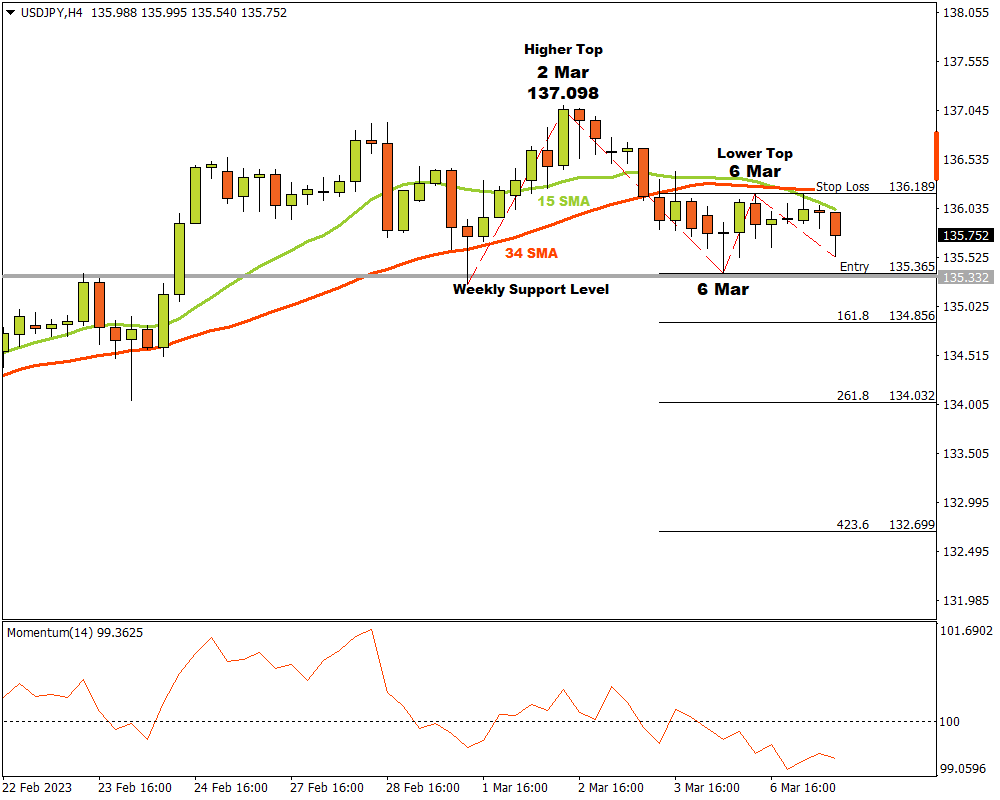
A possible critical support level formed when a bottom started to form at a weekly support level on 6 March at 135.365. The bulls forced the price higher but encountered opposition and a lower top was created later in the same session at 136.189.
If the USDJPY breaks through the critical weekly support level at 135.365, three possible price targets may be reached from there. Attaching the Fibonacci tool to the lower bottom at 135.365 and dragging it to the resistance level near the 34 Simple Moving Average at 136.189, the following targets can be calculated.
The first target may be estimated at 134.856 (161.8%). The second price target can be expected at 134.032 (261.8%) and the third and final target may be anticipated at 132.699 (423.6%).
If the resistance level at 136.189 is broken, the current scenario must be reappraised. As long as the bears can sustain their downward momentum, the outlook for the USDJPY currency pair should remain bearish.
For more information, please visit: FXTM