On all timeframes, without exception, support and resistance levels are of great importance. However, novice traders often do not know how to determine them and Pivot Points come as an effective solution to this problem.
Pivot indicator helps to automatically calculate the boundaries on which limit orders or stop orders used on Forex are placed. In technical analysis, the support and resistance lines are very subjective. They are drawn in various places and often in different ways. But the marks constructed by the pivot indicator according to a certain formula are not subject to a diverse interpretation.
Pivot Level Description
In the literal translation, the word "pivot" means a reversal. In markets, the reversal points are called Pivot Points, and many trading strategies are based on their calculation. It is known that the largest market makers have been using such a computing system for more than half a century. For ordinary traders who trade on daily and intraday timeframes, pivots also provide tremendous help, indicating possible entry points into the deal. Trading using calculated levels brings a good profit.
Even changes constantly occurring on Forex do not affect the effectiveness of pivots in trading (despite the fact that they were discovered long ago). Numerous Pivot indicators developed with the development of computer technology greatly simplify the work of traders. The need for complex mathematical calculations carried out previously by hand has disappeared. However, for a more complete understanding of the essence of reversal levels, you should consider in more detail how they are calculated and displayed on the asset chart.
The Pivot Point indicator calculates levels using the following formulas:
- R1 = 2 * Pivot Point - Low;
- R2 = Pivot Point + (High - Low);
- R3 = High + 2 * (Pivot Point - Low).
This is a calculation of three resistance lines. They are placed on the chart above the central Pivot Point level, the calculation of which is carried out according to the results of the previous trading session (daily chart). In the case of another period, the values of the previous bar are taken into account - High, Low, Close (maximum price, minimum price and closing price).
- Pivot Point = (High + Low + Close) / 3.
Accordingly, the calculation of the three support levels below is performed according to the formulas:
- S1 = 2xPivot Point - High;
- S2 = Pivot Point - (High - Low);
- S3 = Low - 2 * (High - Pivot Point).
Pivot Points Trading
A significant part of traders uses pivots in short-term trading and scalping at time intervals of no higher than M30. For older Pivot Points timeframes, the indicator is used less frequently. Traders with experience do not recommend entering the market, based only on the readings of this instrument. However, to calculate the turning points, it is a good help helping to make the right decision.
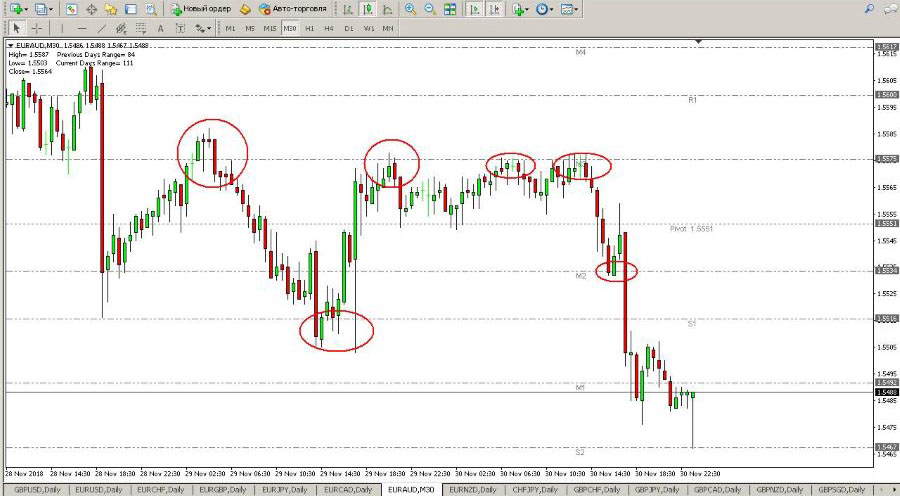
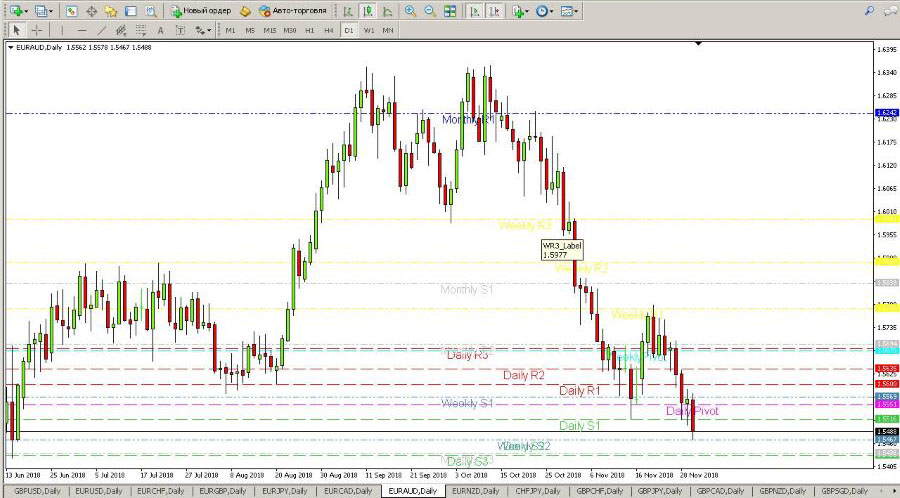
The figure clearly shows how to use the indicated points to open buy and sell orders. Possessing such information, you can set minimum safety stop-loss, reduce potential losses and increase the number of profitable transactions. On the EURAUD pair chart, the price does not always perfectly bounce off the levels. It sometimes punches them, but then comes back again.
Fibonacci Pivot Tool
Significant levels of the Fibonacci pivot-indicator displays according to the calculation formula of the famous medieval mathematician.
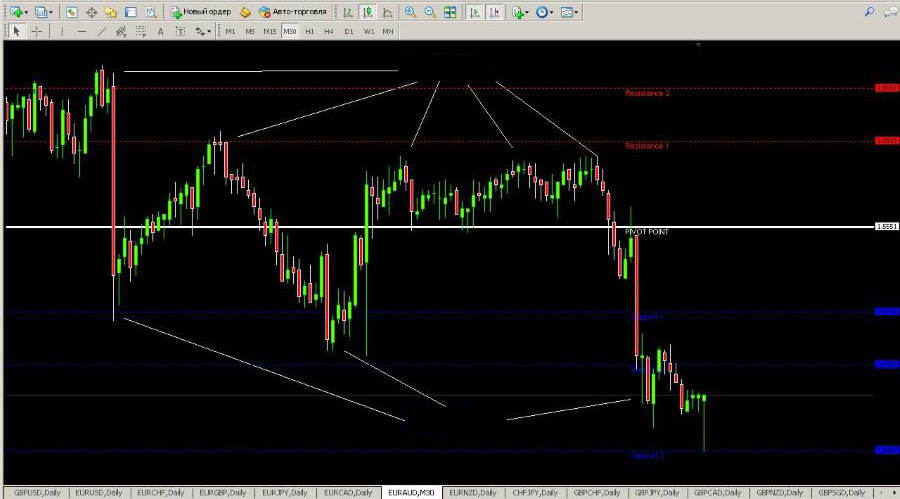
Blue lines on the chart indicate support lines from which you can make purchases at certain points in time. The resistance lines are displayed in red. From them, traders enter the market for sales.
The farther the price moves away from the white line of the Pivot (the main level), the greater the likelihood of a rebound from support or resistance. The indicator has no settings.
Indicator of monthly pivot levels
Many traders open orders for the purchase (sale), focusing on very significant psychological levels. This information is taken into account by market makers, they enter the market with large amounts of equity. Everything is quite logical, since numerous counterparties are needed to buy or sell large volumes of assets. It is in this role that the market crowd acts.
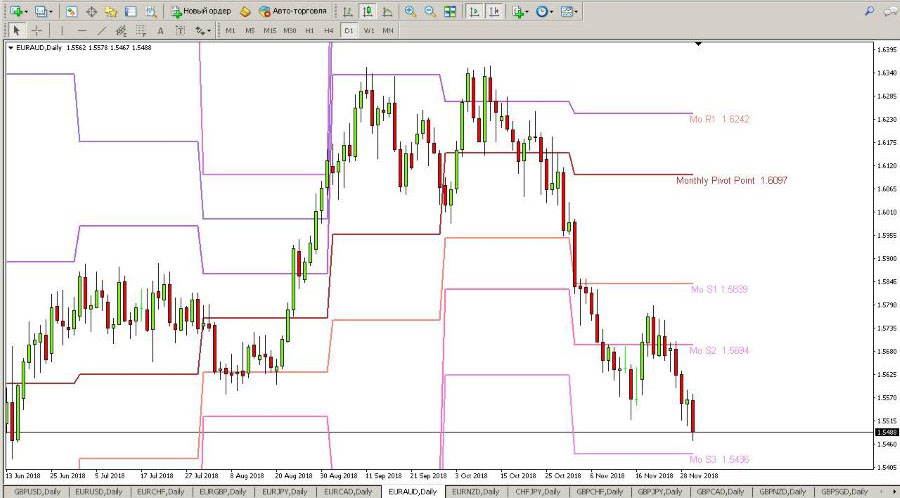
The pivot indicator of monthly levels displays the calculated points in the figure. The daily timeframe allows you to see lines in which the global trend is likely to make a reversal in the opposite direction. However, the indicator does not provide accurate information about such an event; therefore, it can be used as an addition to a long-term trading strategy.
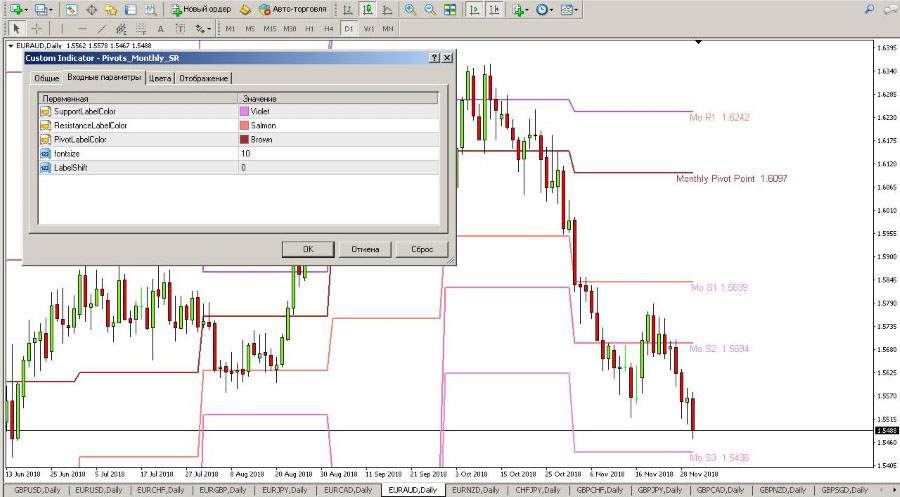
The tool can be customized as you like by changing the colors of support, resistance and the main level. The size and indentation of the text on the chart at the request of the trader decreases or increases.
Auto Pivot 2 Indicator
Unlike other similar tools, this indicator optimizes trading by helping to analyze the market situation using weekly and monthly timeframes. This analysis allows you to make a more accurate forecast of price movements for the future. The formula for calculating levels remains unchanged.
The convenience of the settings is to use the necessary or disable unwanted trading levels of pivots:
- Use Sunday Data - use information for the weekend;
- Daily - visibility of the main daily levels;
- Daily SR Levels - display of daily support and resistance lines;
- Weekly - visibility of the weekly main level;
- Weekly SR Levels - visibility of support and resistance on the weekly timeframe;
- Monthly and Monthly SR Levels - Displays similar levels on a monthly time interval.
Each level on the chart is signed, and confusion cannot arise.
Conclusion
Of course, pivot indicators play an important role in trading, showing significant support and resistance lines on charts. Many traded currency pairs correctly change their movement and make a rebound from these levels.
Indicators are simple in their understanding and perfectly complement the trading arsenal of any trader. Sometimes they are even indispensable in trading. Together with other elements of technical analysis, these tools bring an excellent profit to the trader and minimize possible losses.