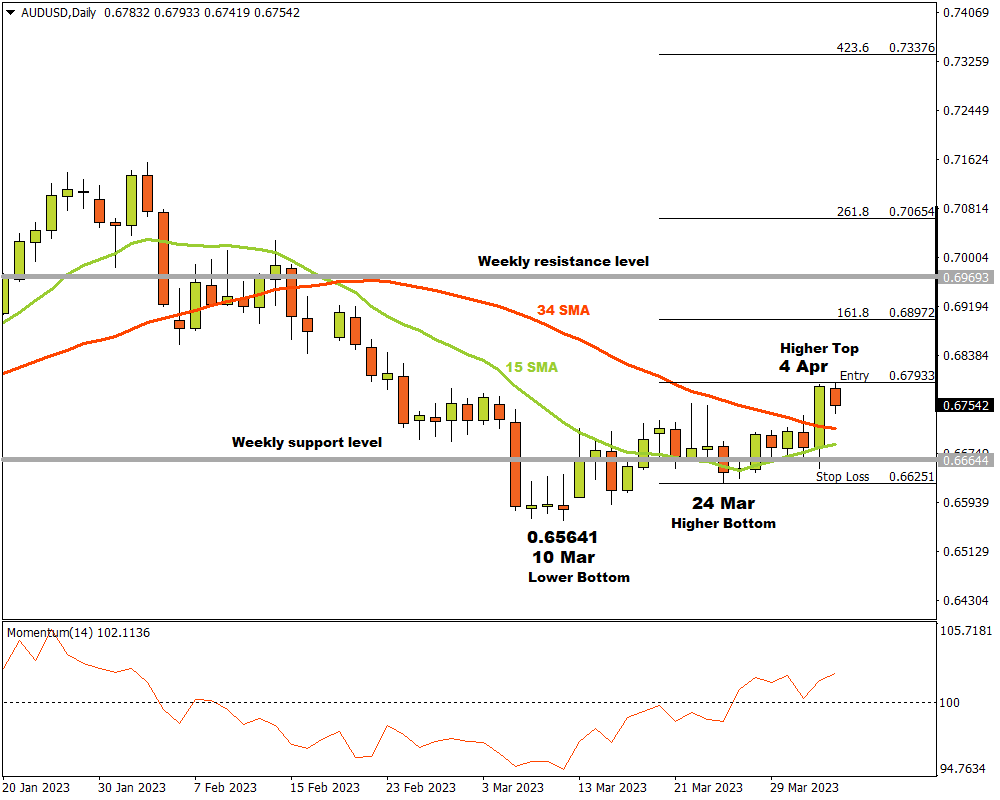
The AUDUSD currency pair was in a down trend on the D1 time frame until a last lower bottom formed at 0.65641 on 10 March. After the lower bottom, the currency pair broke through the 15 and 34 Simple Moving Averages and the Momentum Oscillator waved through the 100 baseline into bullish terrain. Technical traders would have noticed this plain indication that the bears might be losing momentum.
A higher top and possible resistance level was established on 4 April at 0.67933. The bears are currently trying to exert their influence and drive prices lower. They will most probably be aiming for the nearby weekly support level.
If the AUDUSD breaks through the resistance level at 0.67933, three possible price targets can be projected from there. Attaching the Fibonacci tool to the higher top at 0.67933 and dragging it to a higher bottom that formed on 24 March just below the weekly support level at 0.66251, the following targets can be calculated. The first target may be estimated at 0.68972 (161.8%). The second price target can be expected at 0.70654 (261.8%) if the bulls can manage to break through a weekly resistance level, and the third and final target may be anticipated at 0.73376 (423.6%).
If the support level at 0.66251 is broken, the current scenario must be reconsidered. Until a change in market structure that involves a lower top and lower bottom is confirmed, the bulls are definitely in charge of the AUDUSD currency pair .
For more information, please visit: FXTM