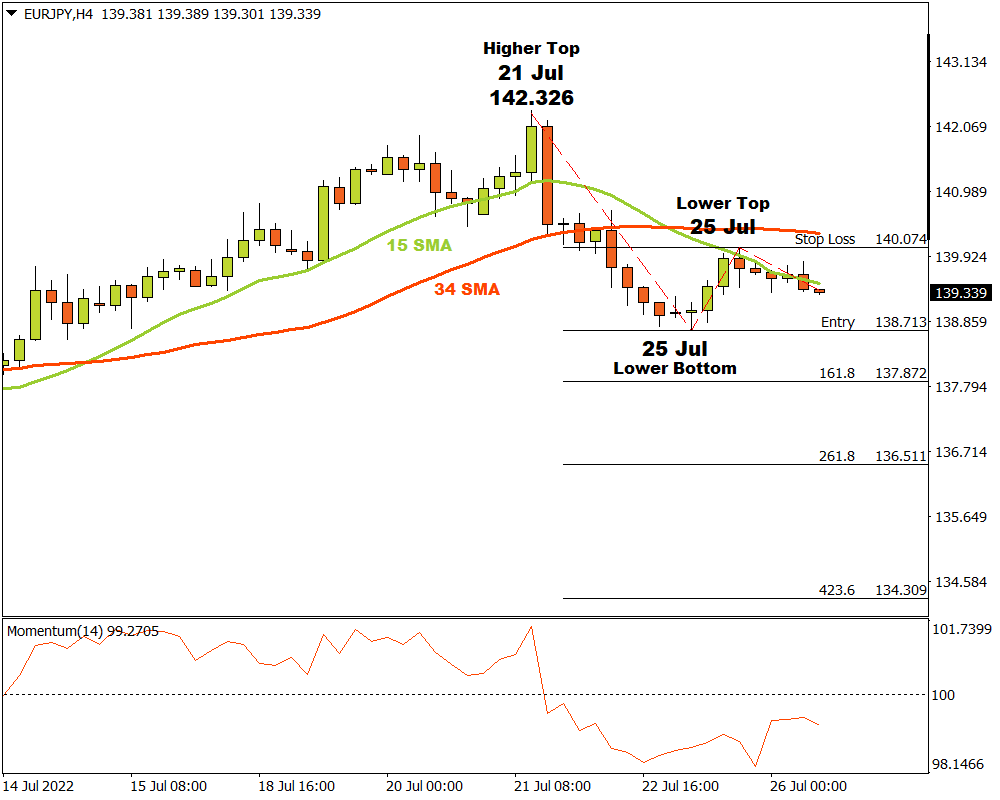
The EURJPY currency pair on the H4 time frame was dominated by the bulls with upward momentum that lasted until 21 July when a last higher top was recorded at 142.326. After the higher top, the bears started getting their ducks in a row with the resulting bearish momentum causing the market to break through the 15 & 34 Simple Moving Averages and the Momentum Oscillator changing direction to the down side, both confirming the shift in market motion.
A possible critical support level formed when a lower bottom was recorded on 25 July at 138.713. Bullish momentum drove the price upwards from there but a resistance level at 140.074 was hit later in the same day with a lower top forming as bearish market action started to increase again.
If the EURJPY currency pair manages to break through the critical support level at 138.713, then three possible price targets can be projected from there. Attaching the Fibonacci tool to the bottom at 138.713, and dragging it to the resistance level at 140.074, the following targets can be calculated. The first target can be estimated at 137.872 (161.8%). The second price target may be calculated at 136.511 (261.8%) and the third and final target may be expected at 134.309 (423.6%).
If the resistance level at 140.074 is broken, the above scenario can be disregarded. As long as the sellers stay in the drivers seat and the market maintains a negative sentiment, the outlook for EURJPY on the H4 time frame will remain bearish.
For more information, please visit: FXTM