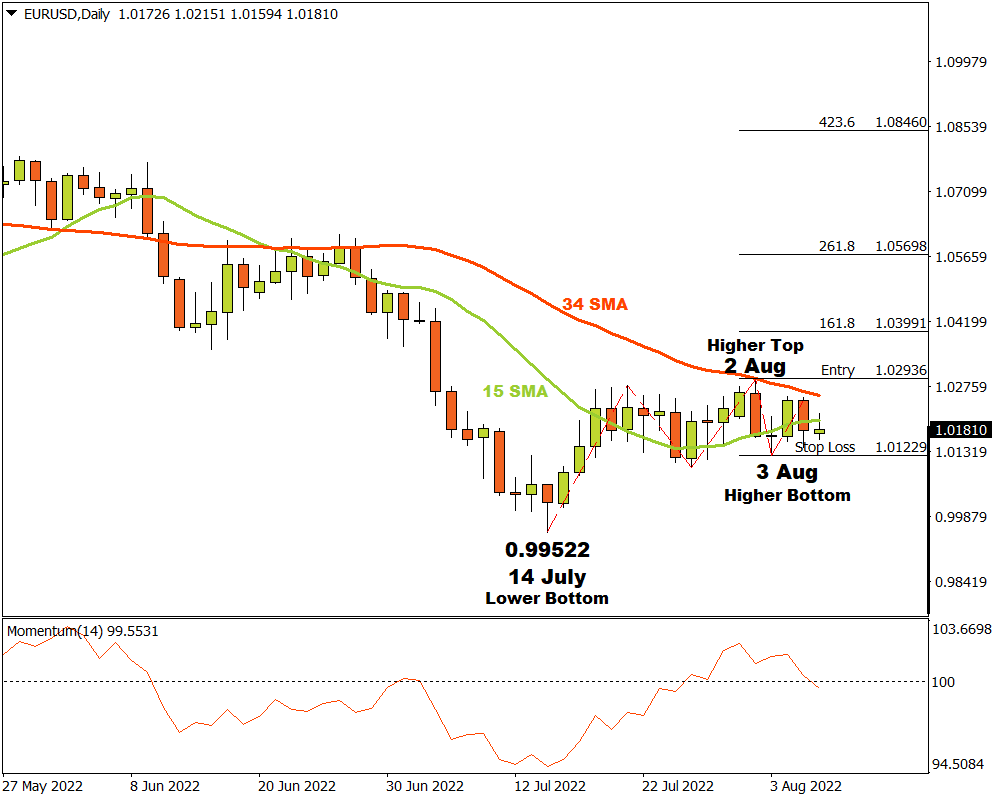
The Euro on the D1 time frame was in a downtrend until 14 July. The bears found the price attractive at those levels and the market momentum started shifting to the upside with a last lower bottom forming at 0.99522. After the lower bottom at 0.99522, the market broke upwards through the 15 Simple Moving Average as well as touching the 34 Simple Moving Average a while later. The Momentum Oscillator also broke through the 100 baseline into bullish terrain.
A critical resistance level formed when a higher top was recorded on 2 August at 1.02936. The bears then drove the price down with a higher bottom forming on 3 Aug at 1.01229 at a support level.
The bulls currently only have a slight edge over the bears, but if the Euro manages to break through the critical resistance level at 1.02936, then three possible price targets can be anticipated from there. Attaching the Fibonacci tool to the higher top at 1.02936 and dragging it to the support level at 1.01229, the following targets can be calculated. The first target can be assessed at 1.03991 (161%), the second price target may be considered at 1.05698 (261.8%). The third and final target may be projected at 1.08460 (423.6%).
If the 1.01229 support level is broken, the anticipated price targets are inconsequential and must be re-considered. As long as the market maintain a positive sentiment and demand overcomes supply, the Euro on the D1 time frame will be considered a bullish scenario.
For more information, please visit: FXTM