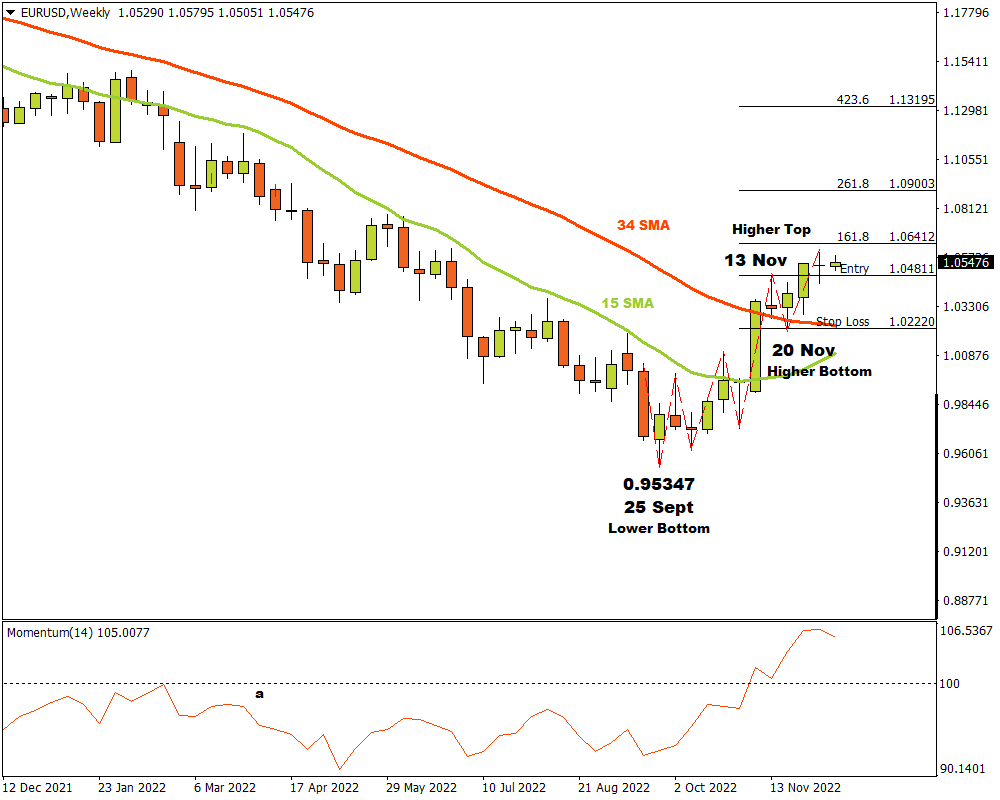
The EURUSD currency pair on the Weekly (W1) time frame was in a remarkably long downward spiral that lasted until a lower bottom formed on 25 September at 0.95347. After the lower bottom, the bulls woke up from their long slumber and started stretching their muscles. The price moved through the 15 and 34 Simple Moving Averages with the Momentum Oscillator breaking through the 100 baseline into bullish territory.
A resistance level formed on 13 November at 1.04811 and the bears frantically tried to take control of the market again. The bulls did not think that was funny and their energy soared with a higher bottom forming on 20 November at 1.02220.
In the course of the week of 27 November the price broke through the resistance level at 1.04811 and three possible price targets were estimated from there. Attaching the Fibonacci tool to the higher top 1.04811 and dragging it to the bottom of a support level near the 34 Simple Moving Average at 1.02220, the following targets was established. The first target was assessed at 1.06412 (161.8%). The second price target is possible at 1.09003 (261.8%) and the third and final target might be projected at 1.13195 (423.6%).
If the support level at 1.02220 is violated, the bullish scenario is no longer valid and should be re-analyzed. As long as the bulls keep their momentum strong with demand overcoming supply, the market sentiment for EURUSD on the weekly time frame will be bullish.
For more information, please visit: FXTM