The EURUSD currency pair on the D1 time frame was in a prolonged uptrend until a higher top formed at 1.10329 on 2 February. The bears decided that the price was just right at those levels and supply started overcoming demand. A closer look at the Momentum Oscillator reveals negative divergence between point “a” and “b” when comparing the tops at 1.09294 and 1.10329, indicating a potential change in the overall momentum of the market.
After making the higher top at 1.10329, the market broke through the 15 and 34 Simple Moving Averages. The Momentum Oscillator also collapsed through the 100 baseline into bearish territory and a weekly support level was broken.
A possible critical support level formed when a lower bottom was recorded on 13 February at 1.06555. The bulls tried to drive the price higher but the bearish reaction at the weekly support now turned resistance level was too strong and a lower top formed on 14 February at 1.08045.
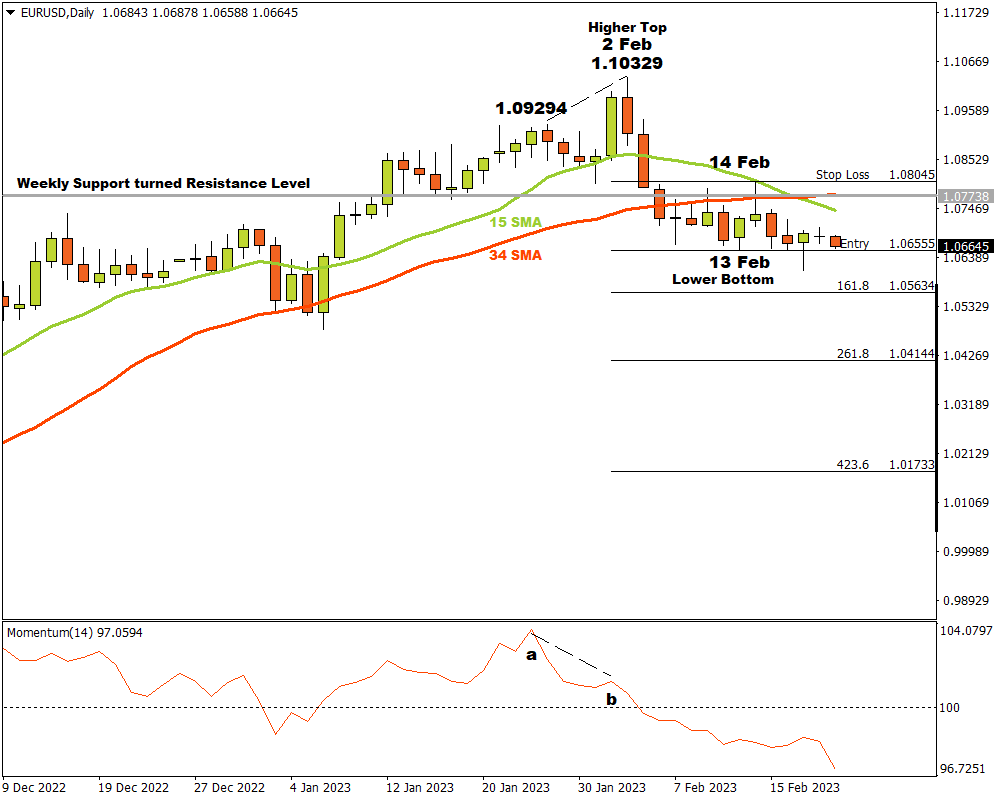
On 17 February the EURUSD broke through the critical support level at 1.06555 and three possible price targets was estimated from there. Attaching the Fibonacci tool to the lower bottom at 1.06555 and dragging it to the weekly resistance level at 1.08045, the following targets were calculated. The first target may be possible at 1.05634 (161.8%). The second price target might be expected at 1.04144 (261.8%) and the third and final target can be likely at 1.01733 (423.6%).
If the resistance level at 1.08045 is broken, the current scenario is invalid and must be re-examined. As long as the bears continue to control the market, the outlook for the EURUSD currency pair will remain bearish.
For more information, please visit: FXTM