This preview of weekly data looks at USOIL and XAUUSD, where oil is trying to regain the losses incurred after some major positive news on the Dollar, and gold is making extraordinary gains. The first important event on the economic calendar for this week is the speech of FED chair J.Powell tomorrow at 2 PM GMT, following the FOMC minutes of last Wednesday, where it showed that the central bank continues to believe it will be “some time” before interest rates can come down, while also noting the economy had improved in the second half of the year.
Currently, the possibility of the FED performing a single hike is currently at 75% showing a temporary slow down by the central bank, but this could be only for the short run if economic indicators decline, especially inflation.
The most important release for this week comes on Wednesday at 1:30 PM GMT and its the US inflation rate for December. The market consensus is at 6.5%, against the previous release of 7.1%. If this scenario is confirmed then it would be the sixth month of continued decline for inflation, and is also the lowest figure for 2022, and even lower than the 7% of December 2021. The aggressive rate hike by the FED should lower inflation. On the other hand, this could be negative news for the Dollar, since it would reinforce the possibility of a more dovish stance by the FED in future meetings.
Oil, daily
The price of oil made a jump of around 3% on Monday, after the Chinese government moved to reopen its borders following a strict zero-COVID policy. After “reopening” the economy of the largest crude oil importer and hopes for a more dovish stance by the FED in the following meeting, the sentiment for oil demand was boosted by traders pushing the price up.
In the previous week, after positive news for the dollar, such as a decreased trade deficit on the balance of trade, we saw a lowered unemployment rate and better than expected NFP. This created some losses on the oil chart against a stronger dollar, and is currently on the move to regain those losses.
On the daily oil chart, we see the price rebounding to the upside after finding support on the lower band of the Bollinger bands and is currently trading just above the 23.6% of the Fibonacci. This is an important area on the chart because its between the Fibonacci level and the 20 day moving average. If we see a valid break above this area, then we might see some resistance around the $78 level, which consists of the slower 50 day moving average and also just below 38.2% of the Fibonacci.
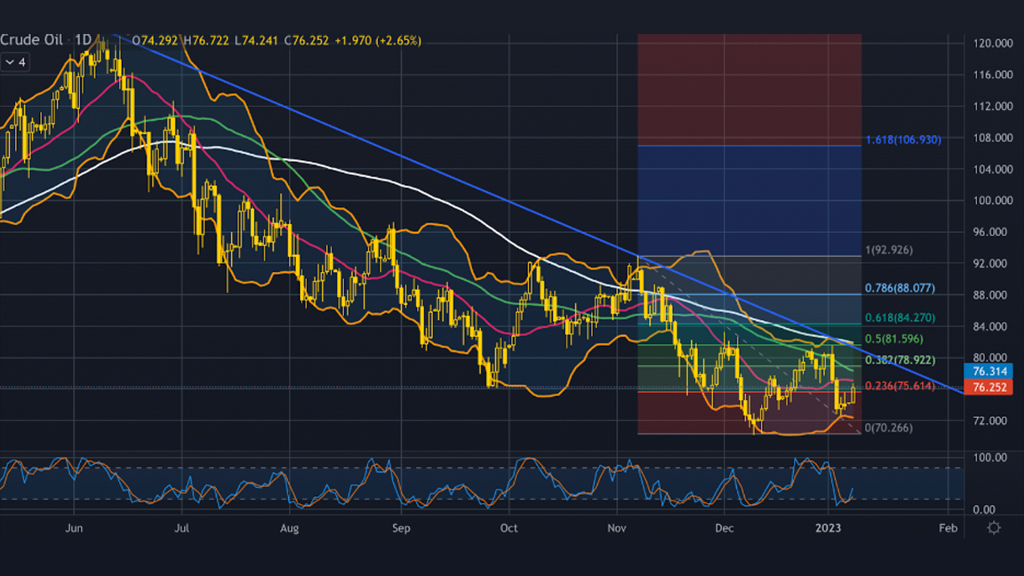
Given that on the Stochastic indicator the %K which is presented by the blue line crossed above the %D (orange line), it is very likely to see the trend continuing up in the following sessions. If the price resumes the overall bearish movement, then we might expect some support around the $70.50 level, which is the last area of price reaction in early December.
Gold-dollar, daily
As the Dollar is slipping in recent sessions amidst signals of the FED slowing down their pace on the upcoming meeting on the 1st of February, gold is making extraordinary gains reaching a seven-month high. Similarly to gold, the reopening of the Chinese economy has helped boost the price of the “yellow metal”. On the other hand, concerns that the outflow of Chinese tourism picking up may cause another surge in COVID infections, and growing worries about a deeper global economic downturn could cap any optimism in the markets if this scenario is confirmed.
From the technical point of view, we see the price breaking above the bullish wedge formation that was in effect for the last couple of months, and currently “walking the line” as the saying goes when the price is trading on the Bollinger bands.
This shows increased volatility in the gold market, with the expanding Bollinger bands confirming. The price is trading on a resistance level of price reaction since mid June 2022, which in combination with the upper band of the Bollinger bands makes the current level a strong technical resistance area.
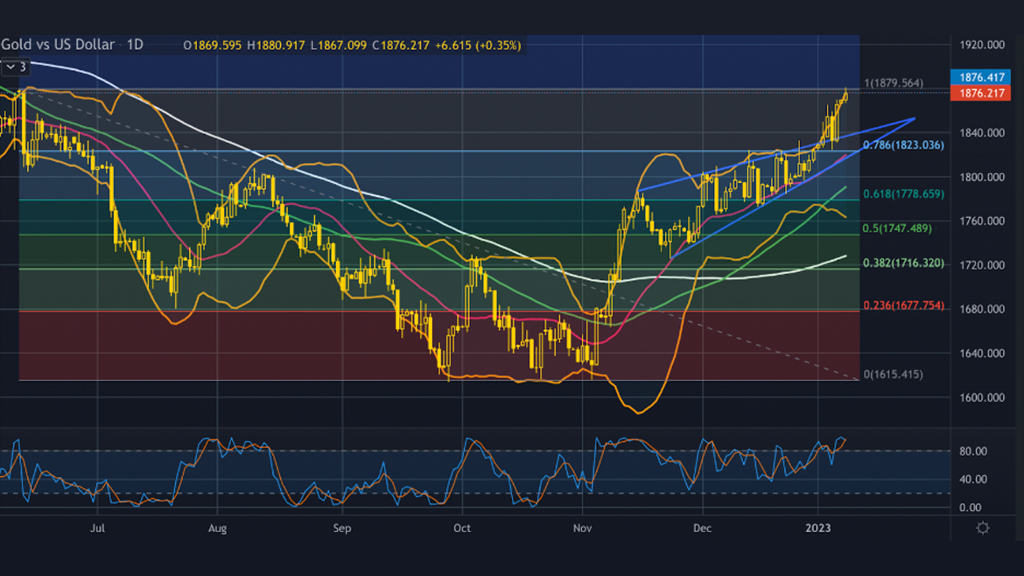
The Stochastic indicator is in the extreme overbought level, and in addition to the technical resistance, make the scenario of a correction to the downside very probable. If we observe a bearish movement in the following sessions, we could possibly expect some support on the price around $1,825, which is just above the 78.6% of the daily Fibonacci retracement level, and also the psychological support of the round number.