In the ever-evolving landscape of the oil market, traders are experiencing a mix of optimism and uncertainty. Recent developments in the United States, China's import trends, and Angola's surprise exit from OPEC have all contributed to the market's complexity. This article delves into these crucial factors and concludes with a technical analysis of WTI crude oil's four-hour chart, shedding light on potential price movements.
The United States, a significant player in the global oil market, has seen a decline in the number of active oil rigs, dropping to 501, according to Baker Hughes. This trend reflects a lack of demand in the US market, reinforced by the American Petroleum Institute's (API) report of increased US oil inventories. The Energy Information Administration (EIA) also unexpectedly reported a rise in US oil inventories by 2.9 million barrels, accompanied by record-high US crude oil production levels of 13.3 million barrels per day (bpd).
These developments suggest that US oil production has surpassed domestic demand, potentially weakening oil prices. Continued signs of a sluggish US market could further exert downward pressure on prices.
The Demand Side
On the global demand side, China's increased imports of Russian oil signify potential growth in demand from its manufacturing-centric economy. However, China also anticipates a slowdown in domestic oil production, compelling the nation to boost imports. The recovery of China's manufacturing sector, a major consumer of oil, remains uncertain, casting a shadow on demand prospects.
Angola's Departure from OPEC
A significant development on the supply side is Angola's decision to exit the OPEC oil production organization. Angola's oil production, contributing 1.1 million bpd, plays a substantial role in OPEC's total production of 28 million bpd. The exit stems from Angola's disagreement with OPEC's lowered production levels for 2024.
Angola's departure has two key implications. First, it grants Angola the freedom to increase production levels and pursue a larger market share.
Second, it may encourage other oil-producing countries to adopt similar volume-focused marketing strategies, potentially increasing the global oil supply. This announcement highlights the challenge faced by Saudi Arabia, which seeks to manage internal divisions within OPEC. If more African oil-producing nations follow Angola's lead or indicate such tendencies, global oil supply may expand, pressuring prices downward.
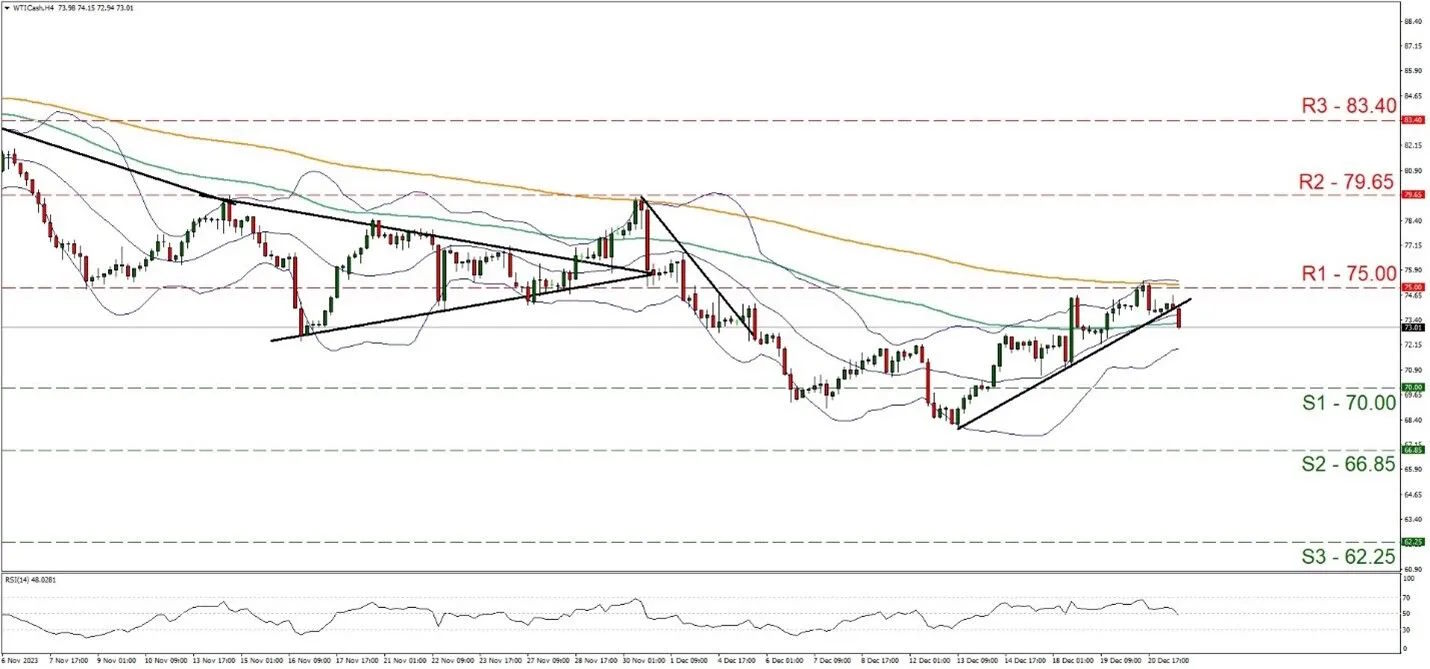
Oil: Technical Analysis of WTI Crude Oil: WTI Cash 4 Hour Chart
- Support: 70.00 (S1), 66.85 (S2), 62.25 (S3)
- Resistance: 75.00 (R1), 79.65 (R2), 83.40 (R3)
WTI's recent price action has corrected lower after encountering resistance at the 75.00 (R1) level. Notably, the upward trendline that guided its movement since December 13th has been breached, signaling a potential shift from a bullish to a sideways trend. Additionally, the Relative Strength Index (RSI) has dipped below 50, indicating a waning bullish sentiment.
If bears seize control, WTI may break below the 70.00 (S1) support level and target the 66.85 (S2) support. Conversely, renewed buying interest could lead to a reversal, breaking the 75.00 (R1) resistance and aiming for the 79.65 (R2) resistance zone.
Conclusion
The oil market remains a dynamic arena influenced by a multitude of factors. While US market conditions, China's demand, and Angola's exit from OPEC introduce both bullish and bearish elements, the technical analysis suggests a possible shift in momentum. Traders should remain vigilant and adaptable in the face of evolving dynamics, as the road ahead for oil prices remains uncertain.