GBPUSD on the D1 time frame was in a short and choppy down trend until 8 March when a last lower bottom was recorded at 1.18016. Bullish sentiment took over and prices started to climb, having now punched above its 50-day simple moving average (SMA). Today, GBPUSD reached its highest levels since February 2nd, following the just-released UK February CPI figures. The headline year-on-year figure remained in double-digit territory at 10.4%, exceeding market forecasts for a 9.9% print. The higher-than-expected inflation data duly prompted markets to ramp up expectations for a 25-basis point hike by the Bank of England at tomorrow’s rate decision, even as contagion fears fade away for the time being.
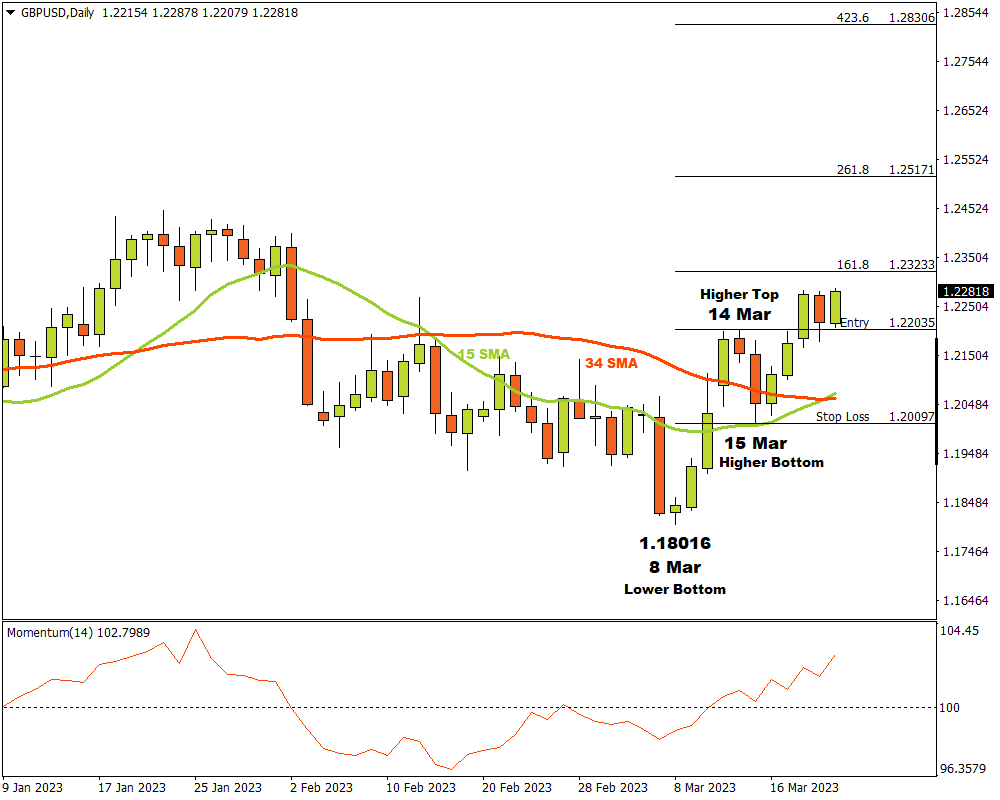
After the lower bottom at 1.18016, the price also broke through the 15 and 34 Simple Moving Averages with the Momentum Oscillator also swinging into the bullish terrain. This would have warned technical traders that bullish momentum was building.
A higher top and possible critical resistance level formed on 14 March at 1.22035. The bears did their best to pull prices lower from there, but a higher bottom formed on 15 March at 1.20097 as the bulls resumed their steady rise.
GBPUSD D1: Bullish sentiment is on the rise
On 20 March the price broke through the critical resistance level at 1.22035 and three possible price targets were calculated from there. Applying the Fibonacci tool to the higher top 1.22035 and dragging it to the higher bottom at the support area near 15 Simple Moving Average, the following targets were considered. The first target might be likely at 1.23233 (161%), with the second price target feasible at 1.25171 (261.8%). The third and final target may be possible at 1.28306 (423.6%).
If the price at 1.20097 is broken, the bullish scenario is invalidated and all open risk must be managed very carefully. As long as bullish momentum continues to increase, the outlook for the GBPUSD on the D1 time frame will remain to the upwards.
For more information, please visit: FXTM