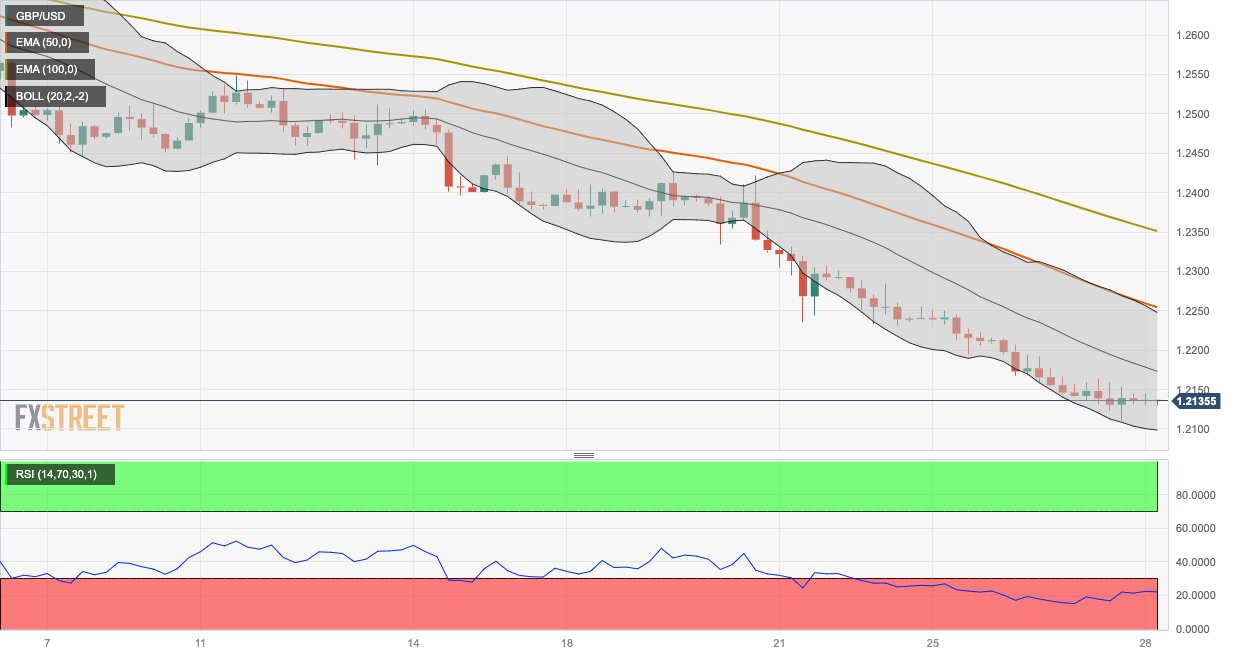
GBP/USD continues to grapple with sustained selling pressure, lingering around 1.2133 and rebounding slightly from its lowest point since March 17 at 1.2110. The currency pair is ensconced below the critical thresholds of the 50- and 100-hour Exponential Moving Averages (EMAs), with the oversold condition of the Relative Strength Index (RSI) accentuating the bearish landscape.
Market Dynamics
The pair's persistent downside, marking its seventh consecutive day of decline during Thursday's Asian trading session, finds its catalyst in the resolute strength of the US Dollar (USD), the ascent in Treasury Yield, and a plethora of upbeat US economic indicators. Currently oscillating near 1.2133, the pair manifests a 0.02% loss on the day, highlighting the prevailing market turbulence.
A conspicuous divergence in monetary policy between the Bank of England (BoE) and the Federal Reserve (Fed) has intensified the pressure on the British Pound (GBP). The BoE’s unexpected pause in the rate hike cycle juxtaposed with the Fed's hawkish stance and indications of possible additional rate hikes serve as formidable headwinds, constraining the upward mobility of the GBP/USD pair.
Technical Outlook
From a technical perspective, the bearish outlook is accentuated by the pair’s position below the pivotal 50- and 100-hour EMAs. The downward inclination of these averages posits a favorable environment for further depreciation. The RSI, entrenched below 50, delineates the prevailing bearish momentum. However, the inherent oversold condition of the RSI implies potential consolidation before any substantial near-term depreciation materializes.
Critical Levels
On the ascendant trajectory, significant resistance is anticipated to surface at 1.2250, aligning with the upper boundary of the Bollinger Band and the 50-hour EMA. Subsequent hurdles are envisaged at 1.2351 (the 100-hour EMA) and 1.2421 (high of September 21), culminating at the psychological benchmark of 1.2500.
Conversely, the critical demarcation of support for GBP/USD is positioned at 1.2100. This level represents a confluence of several pivotal elements – the lower limit of the Bollinger Band, a psychological barrier, and the low observed on March 17. A breach of this level may pave the way towards 1.2025 (low of March 16), and further downward movement may encounter the next threshold at the round mark of 1.2000.
Conclusion
The GBP/USD pair remains ensnared within a matrix of selling pressure and market volatility. The incongruent monetary policy trajectories of the BoE and the Fed accentuate the constraints on the pair, offering limited scope for upward mobility. The fusion of technical indicators and market dynamics portrays a tableau of a bearish market, with the critical juncture at 1.2100 serving as a decisive point for future market trajectories. The ensuing market developments and adjustments in monetary policy frameworks will play a pivotal role in shaping the next phase of the GBP/USD journey in the forex landscape.