The GBPUSD pair remains a fascinating study in currency dynamics, displaying a complex interplay of technical patterns and potential breakout signals as it grapples with significant historical resistance and support levels. Rewinding to its recent past, GBPUSD registered a notable peak at 1.3141 about 18 months ago. This high was an indicator of bullish strength, but since then, the currency pair has charted a more somber journey. It's marked by a consistent series of lower highs and lower lows, painting a picture of bearish domination. However, every bearish trend finds its nadir, and for GBPUSD, this seemed to come with the seven-month low of 1.2036.
Despite this, the currency pair has been ensnared in a nearly month-long consolidation phase, showing an inability to rebound strongly. The rangebound movement, characterized by its oscillation between the aforementioned low and higher resistance levels, suggests market indecision and the potential for significant volatility ahead.
The Technical Landscape: Pennant Pattern and Momentum Indicators
Delving deeper into its recent movements, GBPUSD has etched a pennant pattern in the short term. For the uninitiated, a pennant is a continuation pattern, signifying a brief consolidation before the previous move resumes, be it bullish or bearish. This pattern is often seen as a precursor to potential breakouts, especially when coupled with other technical indicators.
Speaking of which, the momentum oscillators indicate a slow but definite uptick in bullish momentum. If this momentum continues to build, it could drive the currency pair past key resistance levels.
Potential Paths Ahead
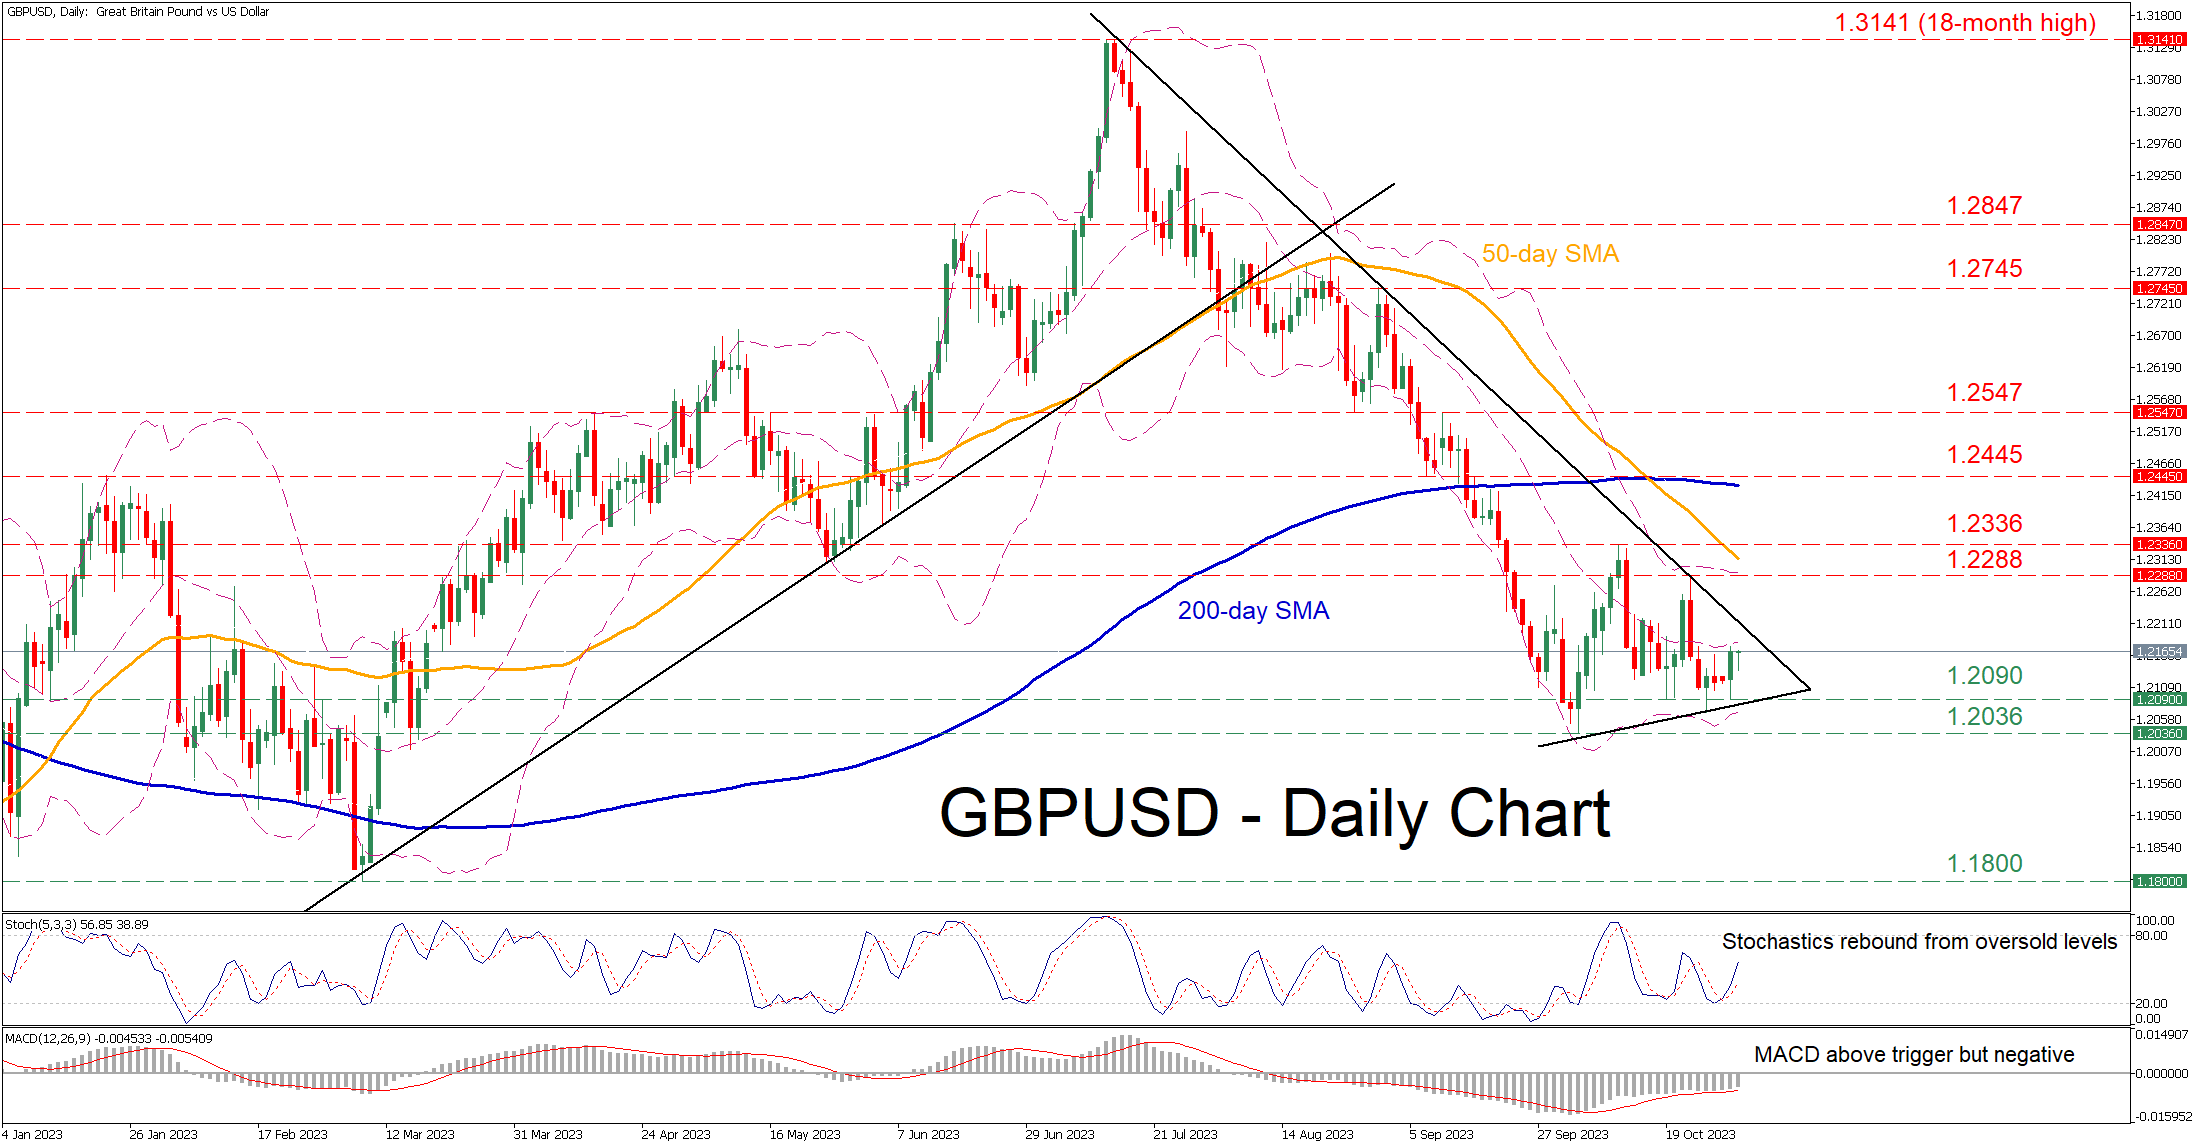
Should the GBPUSD pair experience an uptick in buying pressure, it could encounter resistance at the recent 1.2288 level. A successful breach of this barrier may pave the way for a test of the October peak at 1.2336. Climbing further, the more formidable December-January resistance zone at 1.2445 comes into view, fortuitously coinciding with the 200-day SMA—a pivotal indicator for long-term trends.
Conversely, a bearish turn could see the pair retracting to the support territory near 1.2090. If this level fails to hold, a retest of the seven-month low at 1.2036 becomes probable. A more dramatic bearish scenario might even see the pair nosediving towards the March low of 1.1800, a crucial line in the sand for many traders.
Concluding Thoughts
In essence, the GBPUSD finds itself at a crossroads, hemmed in by its recent range. The brewing combination of a pennant pattern and slowly rising positive momentum presents a tantalizing hint of a forthcoming breakout. Traders and analysts alike will be keenly observing for signs that could indicate the direction of this potential breakout, ensuring the currency pair remains a focal point in the forex market narrative.