The GBPUSD pair encountered a formidable resistance barrier at the 1.2335 mark, prompting a bearish reversal indicative of the market's hesitancy to extend its upward climb. This level, which was once a robust support in May, now serves as a ceiling capping the pair's aspirations for higher valuations. The appearance of a Shooting Star candlestick pattern on the daily chart at this juncture is telling. This pattern, characterized by a small real body and a long upper shadow, typically signifies a bearish reversal when occurring after an uptrend. The pattern's emergence at the 1.2335 resistance level underscores the challenges GBPUSD faces in maintaining its bullish momentum.
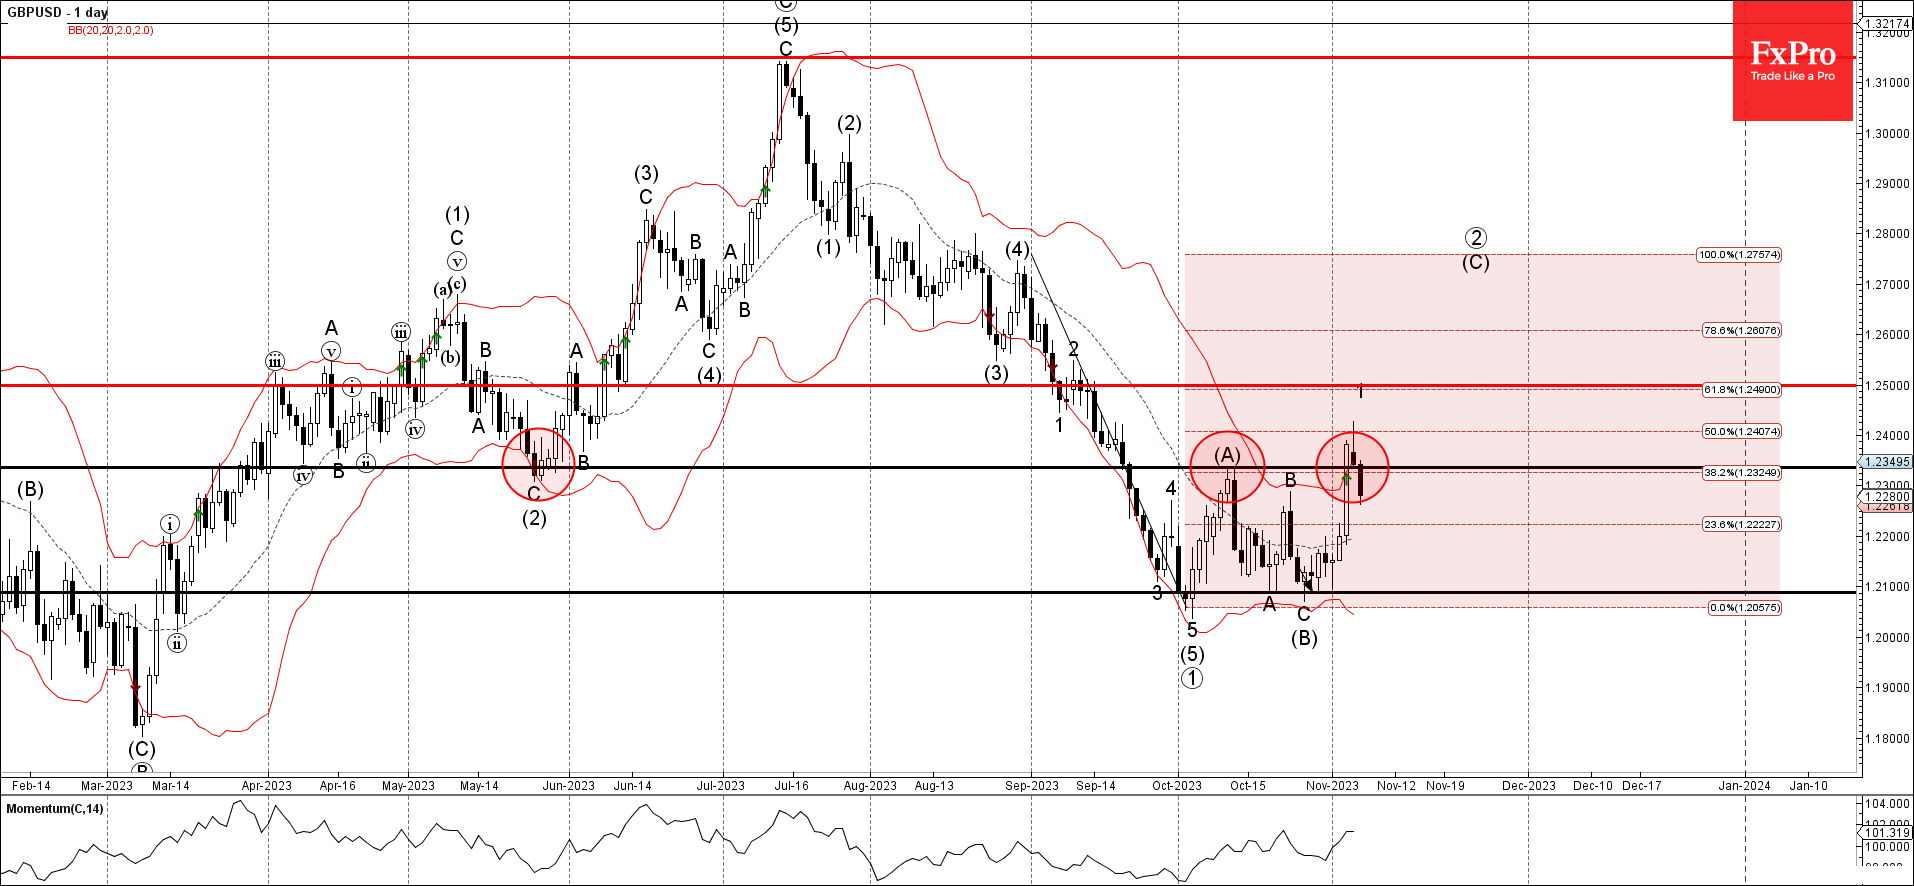
Reinforcing this resistance is the confluence with the upper daily Bollinger Band—a volatility indicator that often doubles as dynamic support and resistance levels. The proximity of the 50% Fibonacci retracement level, pertaining to the significant downward impulse from August, further bolsters the resistance. Such a confluence of technical factors not only validates the resistance level but also hints at the strength of the selling pressure at this threshold.
The Anticipated Downward Trajectory
Considering the robustness of the 1.2335 resistance, a further decline is within the realm of possibility. The immediate target for the bears is the support level at 1.2200. This level is not arbitrary; it may have been derived from past price reactions or psychological adherence, which tends to give round numbers a self-fulfilling potency as traders place orders around these figures.
Should GBPUSD indeed embark on this descent, the journey toward 1.2200 could encounter intermittent support levels that might slow or, in some cases, reverse the course of the price action. Traders often watch these levels for potential entries or exits, making them areas of heightened trading activity.
Beyond the Immediate Forecast
While the short-term outlook appears tilted toward bearish continuation, a broader perspective must account for potential shifts in market sentiment, economic data releases, and policy announcements from the Bank of England and the Federal Reserve, which could abruptly alter the pair's direction.
Moreover, beyond the 1.2200 support, further layers of technical levels might come into play. An extended move down could test previous lows or encounter Fibonacci levels not discussed in the immediate analysis. Similarly, any bullish resurgence will likely retest the 1.2335 level, and a breakout above could invalidate the bearish scenario.
Market Context and Implications
The current technical structure of GBPUSD is a reflection of the market's risk sentiment, economic outlook for the UK and US, and traders' interpretation of price action history. In trading such scenarios, market participants often balance their technical analysis with an understanding of the macroeconomic landscape and geopolitical developments, which can quickly turn technical setups on their head.
In summary, the GBPUSD pair's technical reversal at the 1.2335 resistance level sets the stage for a potential decline towards the 1.2200 support level. Traders and analysts alike will be watching closely to see if the bearish momentum gathers pace or if upcoming economic events provide the catalyst for a change in direction.