GBPJPY has undergone a significant shift in its trading pattern after reaching an eight-year high of 188.64 on November 24, marking the end of a prolonged uptrend that began in January. In the recent short-term, the pair appears to be stuck in a rangebound phase, with its 50-day and 200-day Simple Moving Averages (SMAs) acting as key determinants of its neutral trajectory.
Over the past two weeks, GBPJPY has displayed a lack of clear direction. The 50-day SMA has acted as a resistance level, while the 200-day SMA has offered support. This tug of war between bulls and bears has kept the pair in a relatively tight trading range.
Indicators Point to Bearish Sentiment
Both the Relative Strength Index (RSI) and Moving Average Convergence Divergence (MACD) indicators indicate a prevailing bearish sentiment. These technical indicators are entrenched in their negative zones, further confirming the downside pressure on GBPJPY.
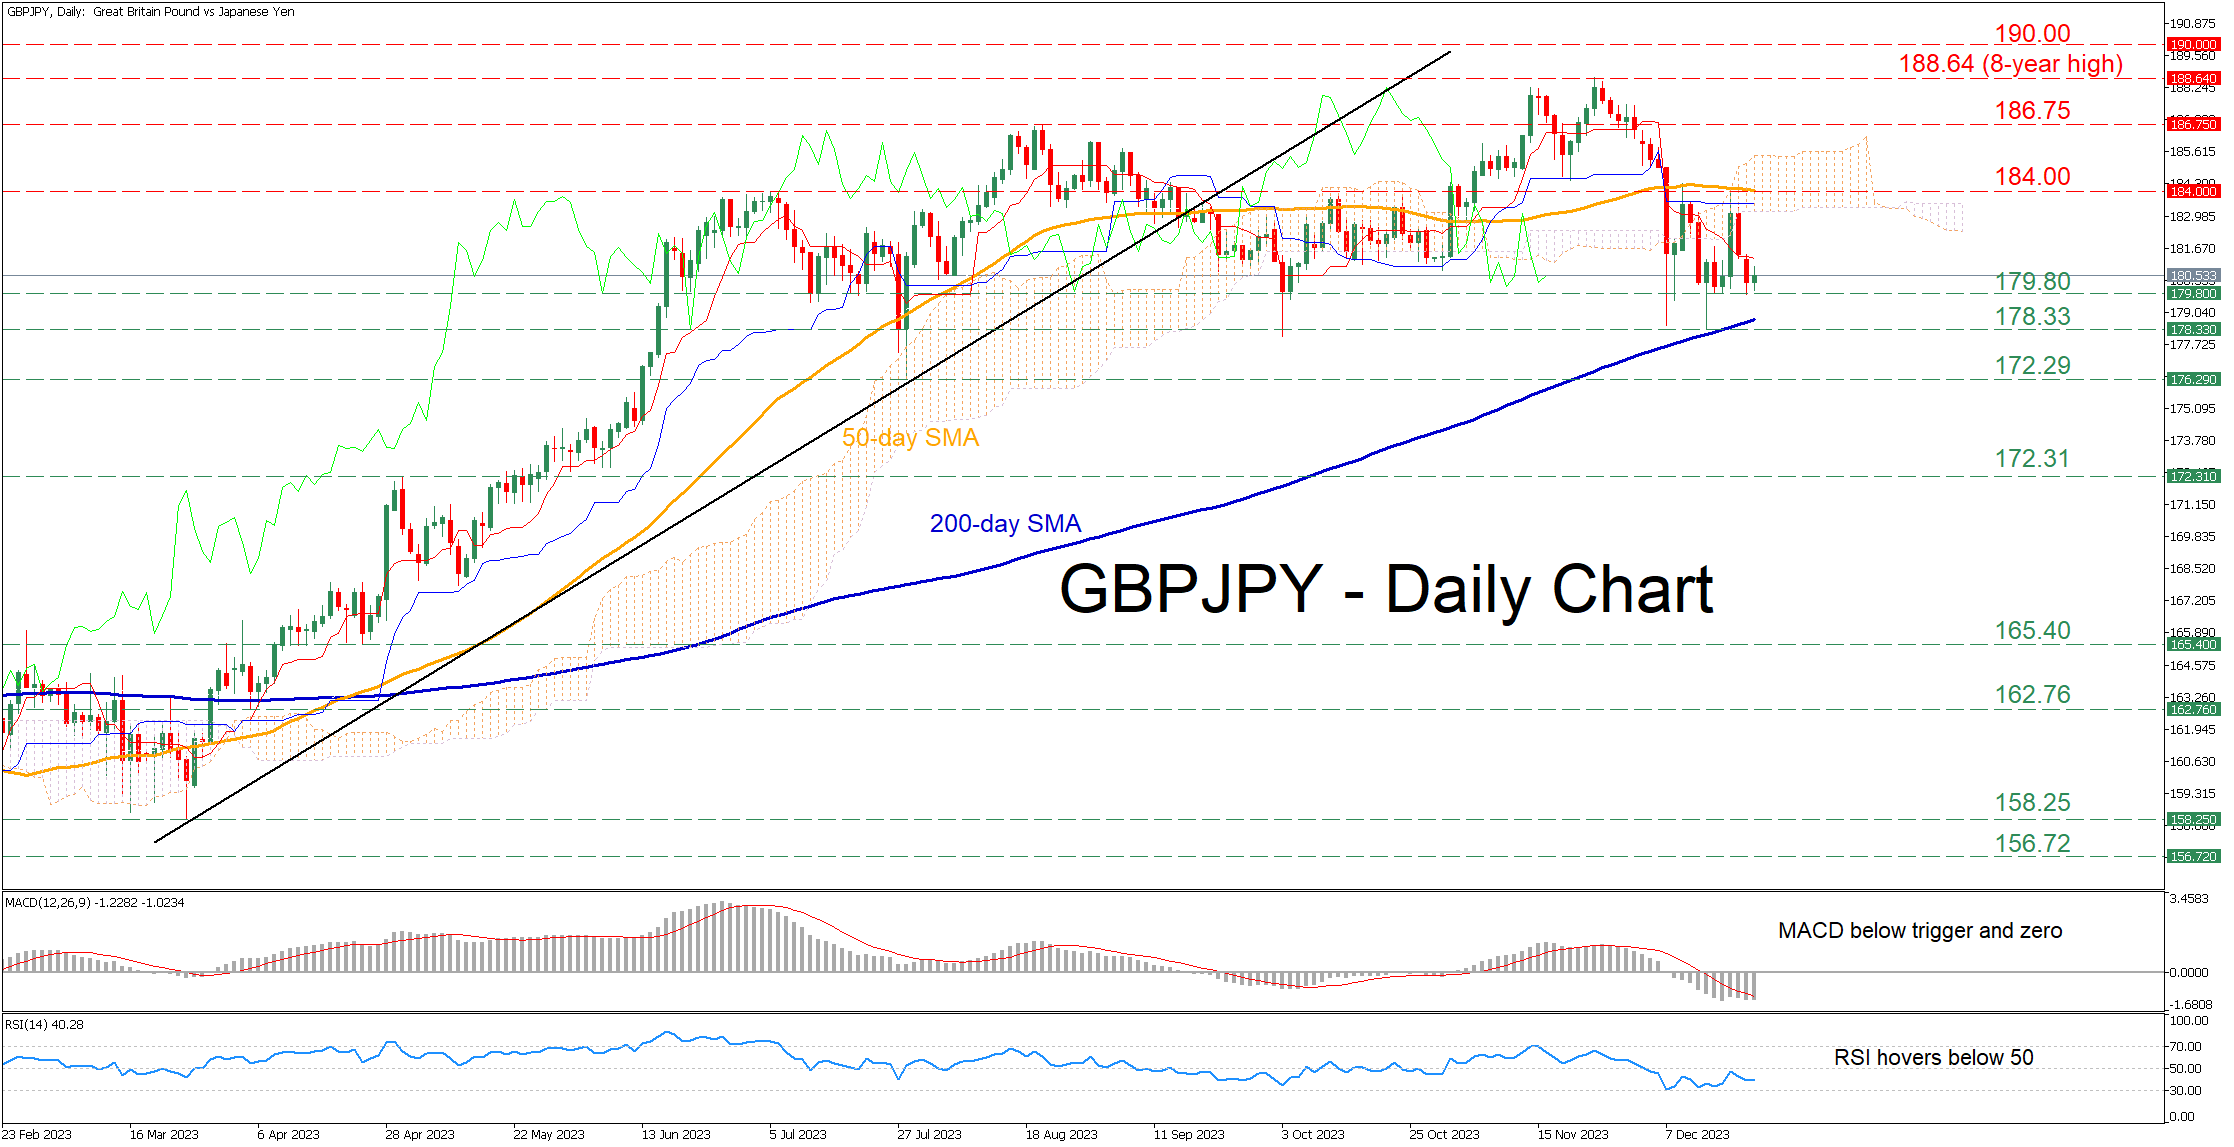
If the current trend persists, GBPJPY may continue to move lower. The recent support level at 179.80 is a crucial area to watch. A breach of this support could lead to a test of the December bottom at 178.33. This level has previously demonstrated resilience in both October and December and coincides closely with the 200-day SMA. Further downside could see GBPJPY targeting the July low of 172.29 as a potential floor.
In the event of a bullish reversal, GBPJPY will encounter immediate resistance at the 50-day SMA, currently positioned at 184.00. This moving average has rejected two upside attempts in December. If the pair manages to breach this resistance, it may set its sights on challenging the August high at 186.75. A breakthrough beyond this level could pave the way for a retest of the eight-year peak reached at 188.64.
GBPJPY's recent price action suggests a consolidation phase as it grapples with its 50-day and 200-day SMAs. The pair's muted tone over the past few sessions indicates the market's indecision and a potential pause in the previous uptrend. Traders should keep a close watch on the key support and resistance levels highlighted above to gauge the pair's future direction.