The Kiwi pair on the H4 time frame was in a downward spiral until 2 July when a lower bottom was reached at 0.69465. Bulls found the price attractive and demand started overcoming supply. A closer look at the Momentum Oscillator revealed a positive divergence between point a and b, compared to the price at 0.69649 and 0.69465. This could have alerted technical traders that a potential technical reversal was in the making.
After the lower bottom at 0.69465, a bullish Three White Soldiers candlestick pattern combined with an upward move, piercing through both the 15 and 34 Simple Moving Averages and a bullish signal when the Momentum Oscillator crossed the zero baseline into bullish terrain, confirmed a possible new trend in the making.
A higher top and possible critical resistance level formed later on 2 July at 0.70366. Bears then tried to pull the price lower but bulls were on the move again. If the Kiwi breaks through the critical resistance level at 0.70366, then three possible price targets may be calculated from there.
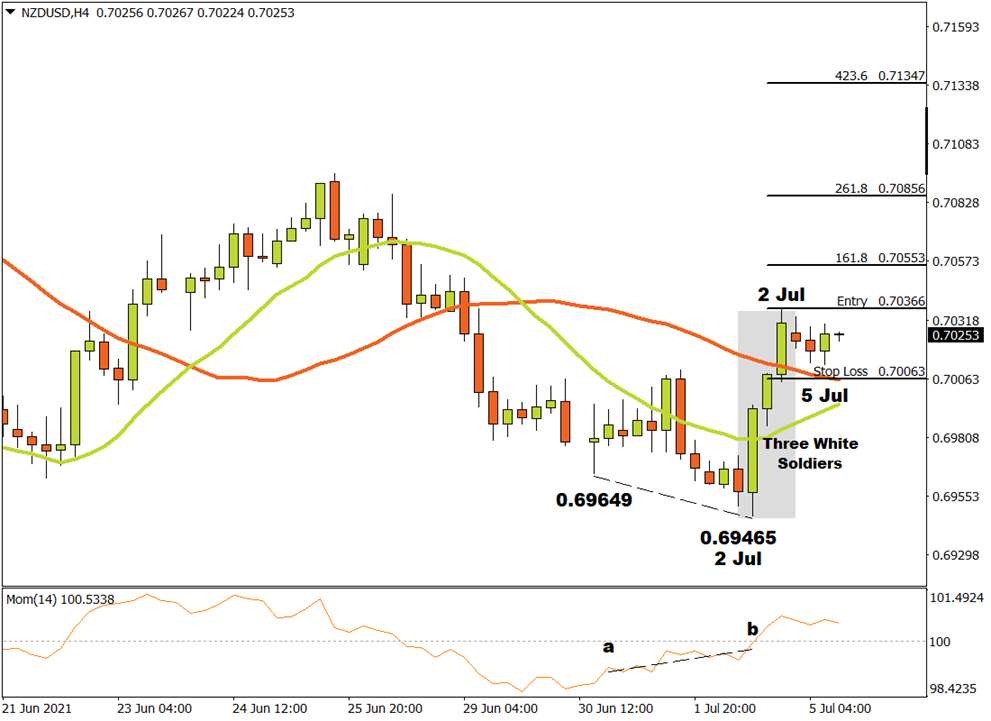
Applying the Fibonacci tool to the top of the resistance level at 0.70366 and dragging it to the bottom of a possible support area near the 34 Simple Moving Average at 0.70063, the following targets could be considered. The first target might be projected at 0.70553 (161%) and the second price target could be likely at 0.70856 (261.8%). The third and final target may be expected at 0.71347 (423.6%) if the uptrend continues making higher top and bottoms.
If the 0.70063 support level is reached, the bullish scenario is invalidated and will need to be re-assessed. As long as bulls maintain a positive momentum and demand overwhelms supply, the outlook for the Kiwi pair on the H4 time frame will remain bullish.
For more information, please visit: FXTM