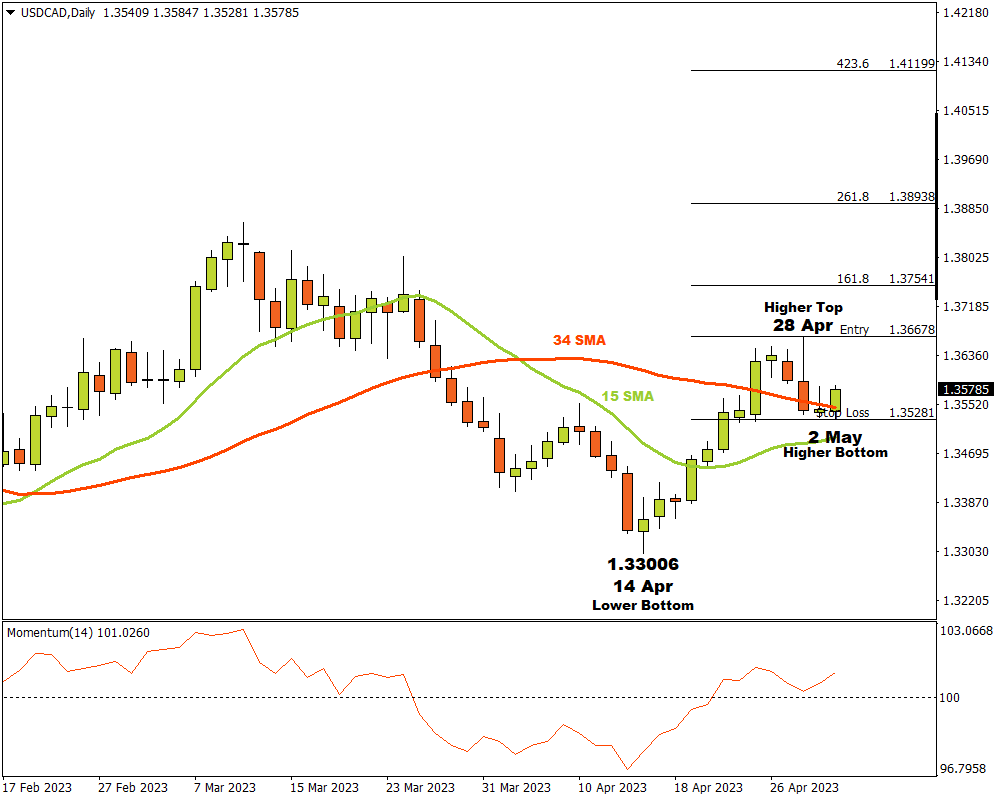
The USDCAD currency pair on the D1 time frame was in a down trend until a lower bottom formed on 14 April at 1.33006. This was what the bulls were waiting for and they started to drive the price higher. After the lower bottom, the price pressed though the 15 and 34 Simple Moving Averages (SMA) and the Momentum Oscillator provided even more confirmation for actively monitoring traders by breaking through the 100 baseline into bullish terrain.
A higher top and possible resistance level was established on 28 April at 1.36678. The bears then exerted their influence and drove the price lower. Near the 34 Simple Moving Average the pair found a possible support level at 1.35281 and the bulls might now be in the process of taking over again.
If the price breaks through the resistance level at 1.36678, then three possible targets are possible from there. Attaching the Fibonacci tool to the higher top 1.36678 and dragging it to the bottom of the support level at 1.35281, the following targets can be established. The first target is possible at 1.37541 (161.8%). The second price target is likely at 1.38938 (261.8%) and the third and final target might be projected at 1.41199 (423.6%).
If the support level at 1.35281 is breached, this scenario is no longer relevant and should be re-analyzed. As long as the bulls keep their momentum with demand overcoming supply, the market sentiment for USDCAD on the D1 time frame will remain bullish.
For more information, please visit: FXTM