The USDCAD currency pair has recently surpassed the pivotal resistance level at 1.3790, a barrier that has consistently capped its upside momentum since last October. This noteworthy breach suggests a strong bullish sentiment for the pair, potentially fueled by the momentum gained from the minor ABC correction 2 that originated around mid-July. A backdrop of enduring bullish sentiment surrounding the US Dollar augments the possibility of the pair setting its sights even higher. The next significant hurdle lies at the 1.3950 resistance level. Notably, this was the point that halted the currency pair's daily uptrend back in 2022 and currently stands as the apex of the prevailing daily upward channel.
Given these technical indicators and the sustained strength of the USD, traders and analysts alike will be closely monitoring the USDCAD, anticipating its potential movement toward and possibly beyond the 1.3950 mark.
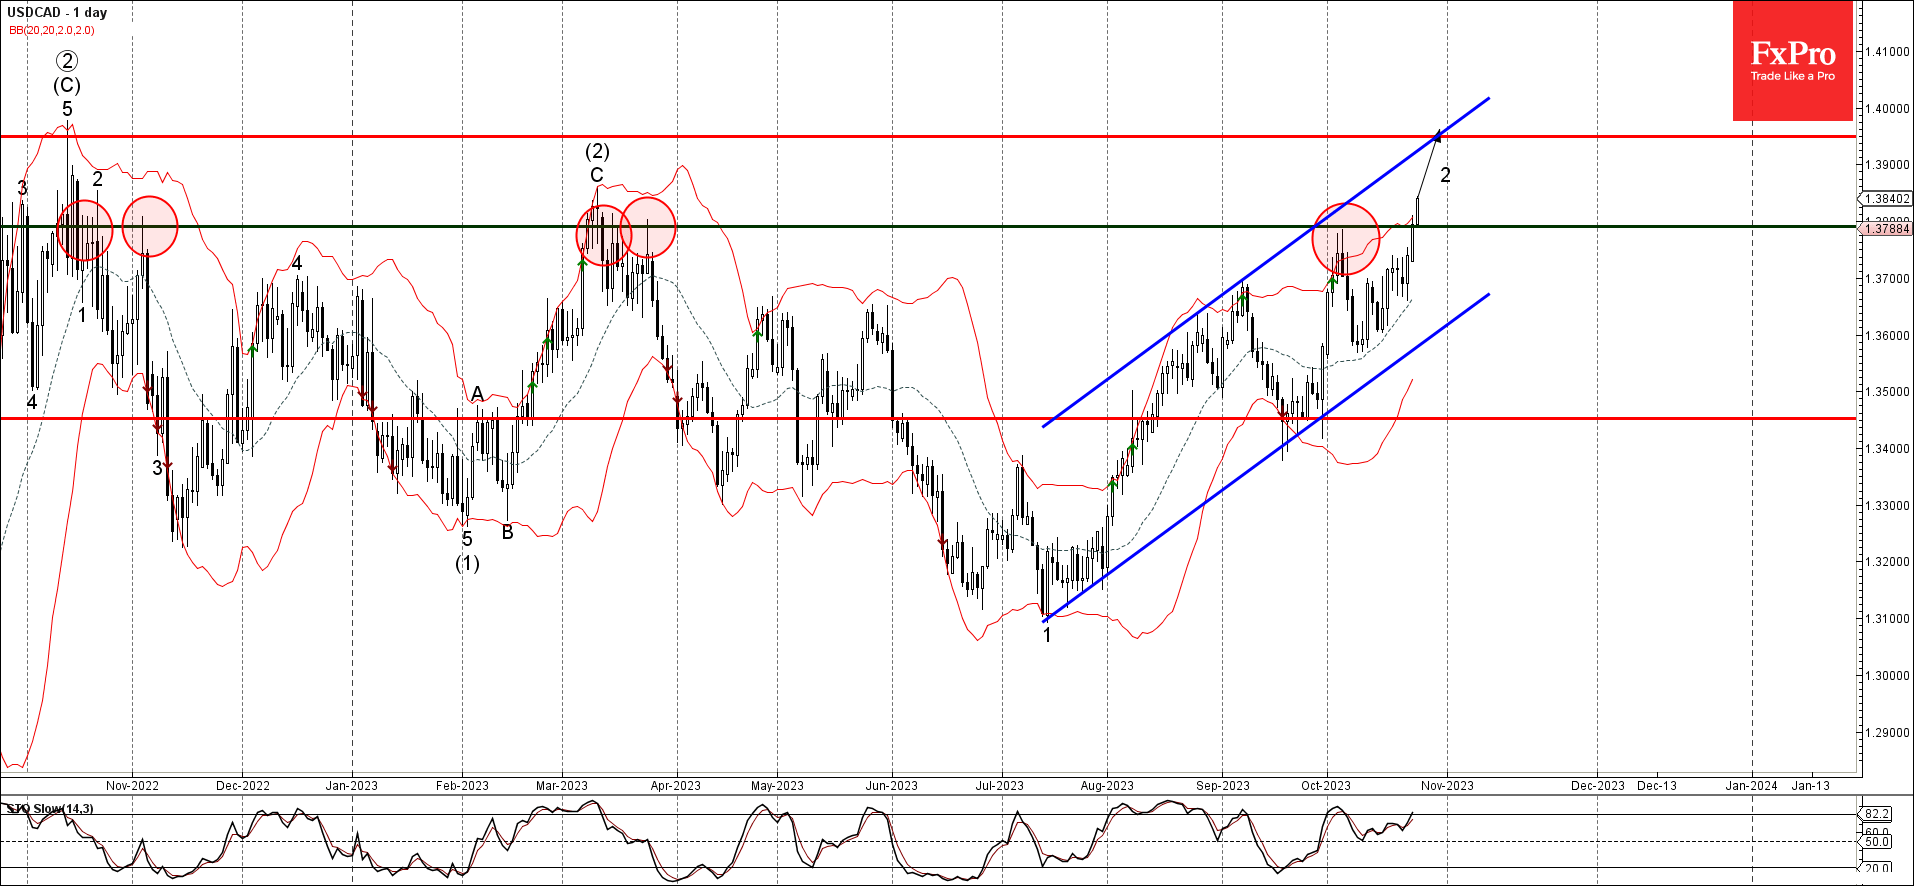
The chart represents the USD/CAD currency pair on a daily time frame
Here are some key observations and analysis:
- Trend Lines and Channels: Two major trend lines can be noticed. The blue ascending trend line has been acting as a support for the price action, while the red horizontal line near the 1.4000 level has acted as a significant resistance. The price has tested this resistance multiple times (indicated by the circled regions) but has failed to break above it consistently.
- Elliott Waves: The chart seems to be annotated with Elliott Wave notations. Elliott Waves consist of motive waves (typically numbered 1-5) and corrective waves (usually marked by letters A, B, C). From the notations, it looks like the price action has completed a 5-wave impulse move and is currently in a corrective phase. The corrective wave seems to be in the C wave, which is typically the last leg of the correction.
- Bollinger Bands: The wavy lines enveloping the price action are Bollinger Bands. There have been times where the price touches or surpasses the upper band, indicating strong upward momentum, and times when it touches the lower band, indicating downward momentum. The bands also expand and contract, suggesting periods of high and low volatility, respectively.
- Support and Resistance: The 1.4000 level is a significant resistance point as the price has tested it multiple times without breaking through. On the downside, the blue trend line and the 1.3400 level seem to offer support.
- Stochastic Oscillator: The bottom part of the chart displays the Stochastic Oscillator, a momentum indicator. The recent crossover where the blue line crosses above the red line in the oversold territory could be interpreted as a bullish signal. However, traders typically look for confirmation from other indicators or price action.
- Recent Price Action: The most recent price movement shows that the pair is once again approaching the significant 1.4000 resistance. The proximity to the upper Bollinger Band and the resistance level might cause traders to watch for potential reversals or breakthroughs.
- Overall Outlook: The USD/CAD seems to be in a corrective phase after a bullish impulse wave. The significant resistance at the 1.4000 level and the approaching upper Bollinger Band may present a potential hurdle for bulls. However, the bullish crossover in the Stochastic Oscillator suggests there might still be some upward momentum.
Traders would be wise to keep an eye on key levels, and also be aware of any fundamental news or events that could impact the USD or CAD, as these can often lead to sudden and significant price movements.