


Secrets of successful trading by Fibonacci levels
It is difficult to find a trader, even among newbies, who have never heard of Bill Williams – the developer of effective indicators integrated into almost every trading platform. In addition, Bill Williams is a successful trader, author of interesting educational materials and effective strategies for trading. His method is called Profitunity. The cost of this strategy ranges from 5,000 to 10,000 USD, and here you can familiarize yourself with it for free and understand why many traders are willing to give that kind of money.
When creating his own trading strategy, Bill Williams was guided by fractal geometry. The trader was convinced that everything in the universe is interconnected, chaotic, but natural. If you read the New York editions of the 80s of the last century, which covered the success of Bill Williams, we can assume that before developing his own method, he used such analytical tools as the Fibonacci sequence, Gann fan and Elliott wave analysis.
This article will focus on the Fibonacci sequence, since it is this mathematician who managed to discover the number of the golden section, which literally obeys everything in the universe. The Fibonacci number sequence is used in various areas of activity, including financial markets, to predict the value of the selected asset. It is worth saying that this tool copes with its task quite successfully, but in order to effectively use it in practice, it is important to become familiar with the proven methods of trading at Fibonacci levels. The strategies discussed further are much easier than new traders might think. It is recommended to spend a few minutes on this material and forget about the probability of losing the deposit forever.
What is a numeric sequence
Fibonacci numbers are a sequence in which each of the following value is the sum of the two previous ones, for example:
- 1 + 1 = 2;
- 1 + 2 = 3;
- 2 + 3 = 5 and so on.
- Thus, the following is obtained: 1, 1, 2, 3, 5, 8, 13, 21, 34, 55, 89, 144.
To understand how the sequence presented above is related to Fibonacci levels, it is important to pay attention to some of its features:
- The ratio of the smaller value to the larger one in the previously presented numerical sequence is exactly 0.618. This value in mathematics is called the number "Phi" or the number of the golden section.
- The ratio of the third number of the sequence to the first is 0.236.
- The range between the levels of 0.236 and 0.618 in trading is called the Fibonacci parabola, on which one of the following effective trading systems is based.
Why are Fibonacci levels not used by novice traders?
Most beginners start practical trading after passing a certain course of theoretical training. Often, similar webinars and lectures are held in the office of a brokerage company. Unfortunately, it often occurs that the knowledge of a trainer in the field of online trading is limited to theory. The training material is presented to students "by the textbook", without focusing on the interesting aspects of individual tools for technical analysis.
Personally, I studied at TeleTrade and after receiving the certificate and passing the exams, I confidently knew how to open the terminal and set the timeframe. The Fibonacci levels were mentioned only in one lecture, and then the manager spent about 10 minutes on this important tool.
Taking into account this approach to learning, we can draw the appropriate conclusions: beginners do not use the Fibonacci sequence in practice, because they simply do not understand how to do it.
Attention! There are enough online courses from private and supposedly successful traders. It is strongly recommended to be trained only in a proven, brokerage company, cooperation with which is not associated with a conflict of interest. The cost of personal courses with a private successful trader can vary in the range from 20,000 to 200,000 RUR. Unfortunately, the quality of education does not match the cost.
It is recommended to pay attention to the proven methods of effectively applying the Fibonacci sequence in trading, which can be started right now.
GAP and Fibonacci
Trading in the gap is one of the easiest strategies for earning in the over-the-counter market. The essence of the method is to place an order at the moment of opening the market in the opposite direction from the price gap, since the gap in nearly 80% of cases tends to close. However, there are several difficulties that do not allow many newcomers to quietly make money on such phenomena:
- After the formation of a price gap, the chart may still move in a similar direction for quite a long time. If in such a situation to open an order at the time of the start of the Asian session, then the drawdown may be significant.
- How to determine target levels when opening an order and limit potential losses?
- How to make a trading plan after the closure of the gap?
Answers to these questions can be obtained with the correct application of Fibonacci levels.
When a price gap is formed, the grid should be stretched so that the level of 23.6 corresponds to the opening point of the first price element in the night from Sunday to Monday, and 61.8 to the opening point of the last candle on Friday evening. These rules are relevant only if the value of the asset selected for trading at the time of opening the market was lower than at the end of the last American session.
If at the moment of opening the market, the price of the asset was higher, then the Fibonacci grid would have to be stretched so that the level of 61.8 corresponded to the market opening point on Monday, and the value 23.6 to the opening point of the last candle on Friday evening. All calculations are recommended on graphs with a period of H1. It is permissible to consider any currency pair for trading, however, it is better to give preference to more trend-oriented financial instruments - EUR/USD, GBP/ USD, AUD/ USD, GBP/ JPY.
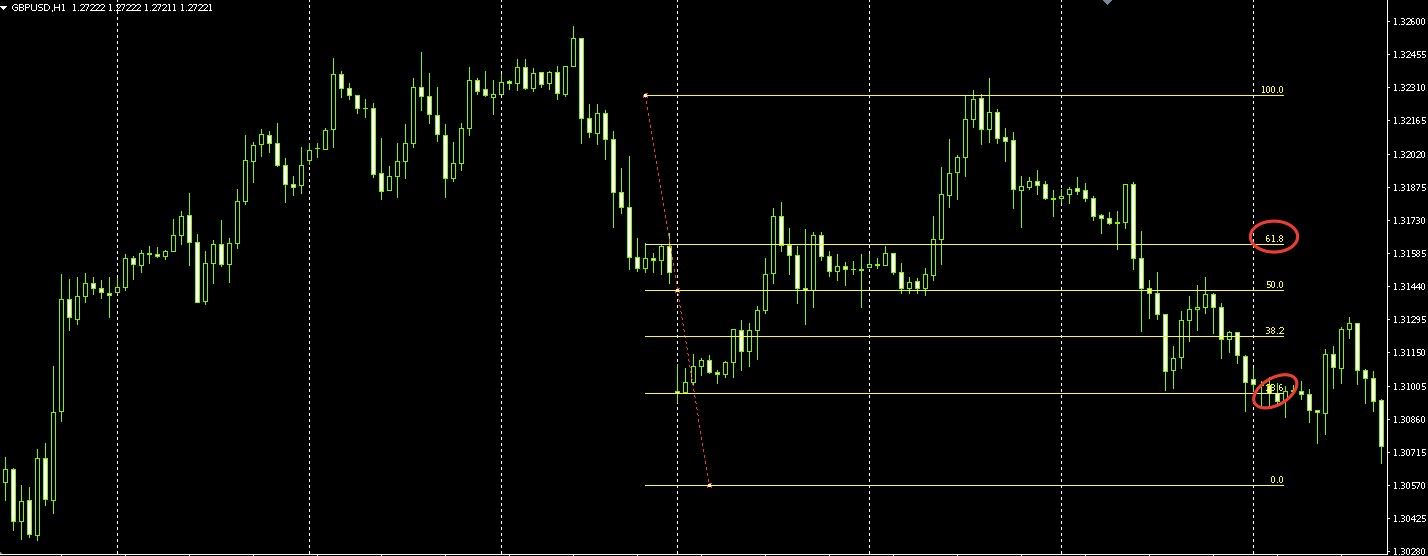 The screenshot shows an example of the correct drawing of the Fibonacci grid on the price chart when forming the gap. The price of the GBP/USD pair at the time of opening the market is lower than on Friday evening, which means the grid will need to be stretched from top to bottom. As you can see from the presented image, the level of 61.8 fully corresponds to the opening point of the last candle of the American session, and 23.6 – the price at the moment of opening the market.
Important! When working with the EUR / USD pair during the formation of the gap, the market may continue to move in the direction of discovery for some time, which will lead to undesirable consequences if the order is not timely opened. Using the Fibonacci grid will allow you to determine the exact entry points. If the chart has overcome the value of 23.6, then you should wait for the touch level of 0.0 and enter the market when the price rebounds from the mentioned value. If the first candle on Monday night closed above 23.6 Fibonacci, then you can open a deal in the opposite direction from the price gap.
Attention! In the first 10-15 minutes after the market opens, opening orders is not recommended due to high liquidity, which leads to a significant spread expansion. If we take into account that the profit potential when trading in gaps is small, then it is simply impractical to enter the market with high spread.
Now it is important to pay attention to the example of trading according to the gap using the Fibonacci grid:
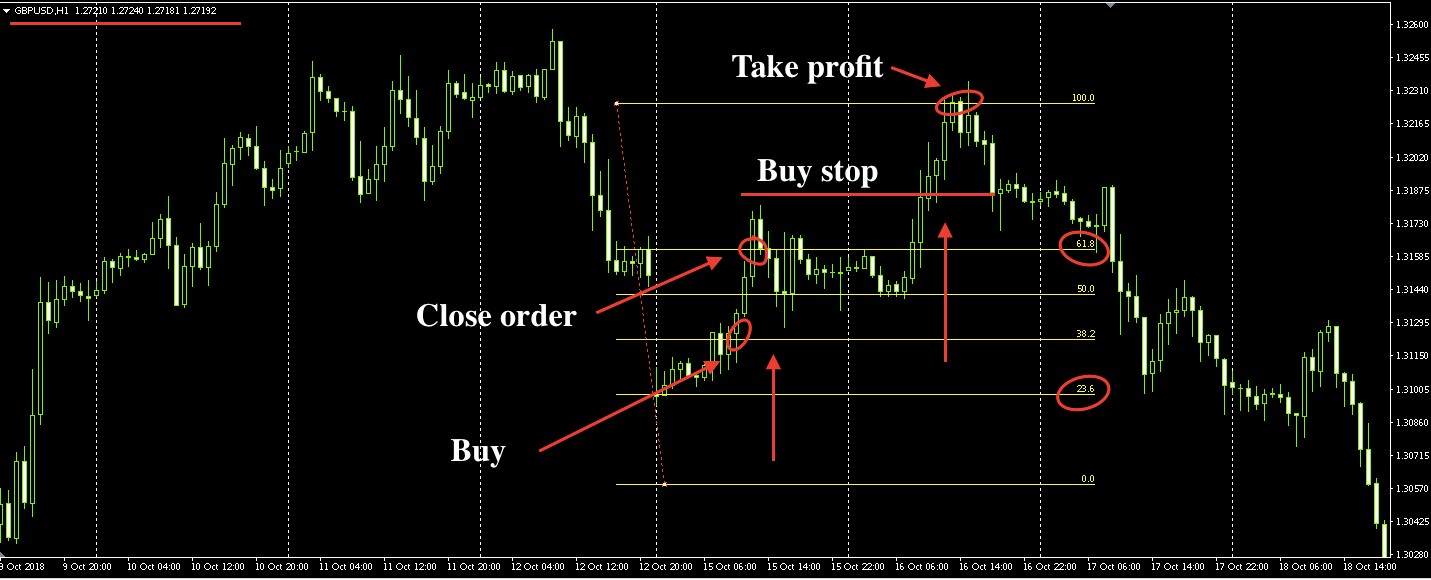
To obtain the expected financial result, it is recommended to open an order only after the graph crosses the level of 38.2. It is quite acceptable to use pending orders. The Take Profit value should correspond to the Fibonacci level 61.8.
If the price has overcome the level of 61.8 and fixed beyond its borders, then it is advisable to open another order with a target level of 100.0. In the screenshot above, the candle broke the Fibonacci 61.8 value, but the next price element returned to the parabola boundaries. As a result, a significant local level was formed, at a distance of 5-7 points from which a pending order can be placed (in this case Buy Stop) in order to enter the market in a timely manner. Take profit value should correspond to the level of 100.0.
Fibonacci Parabola
Another fairly simple but effective method of applying the Fibonacci grid in Forex trading. To begin, you will need to open a chart of one of the trend assets with a period of H4 and stretch the grid from the minimum to the maximum of the previous trading week with an uptrend, and from the maximum to the minimum with a downward. The result should be something like this:
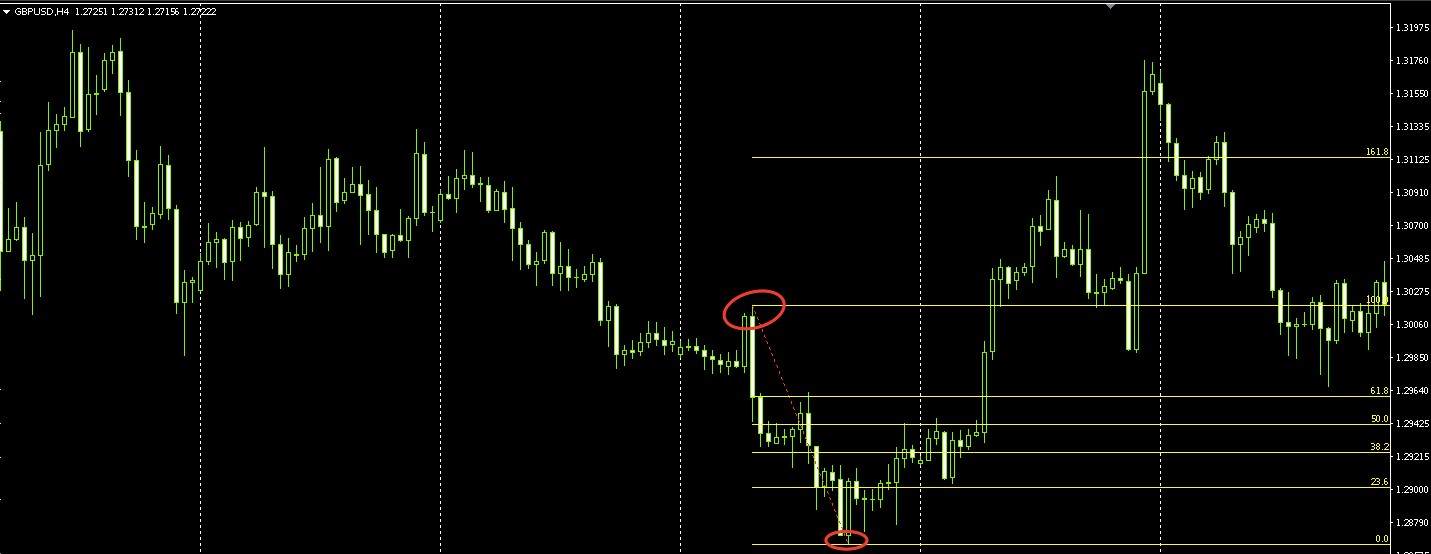
As you can see, a descending trend was formed during the week, so the grid will need to be stretched from top to bottom. Opening orders is allowed only from the beginning of the next week. On the example of an uptrend, the principle of trading is considered:
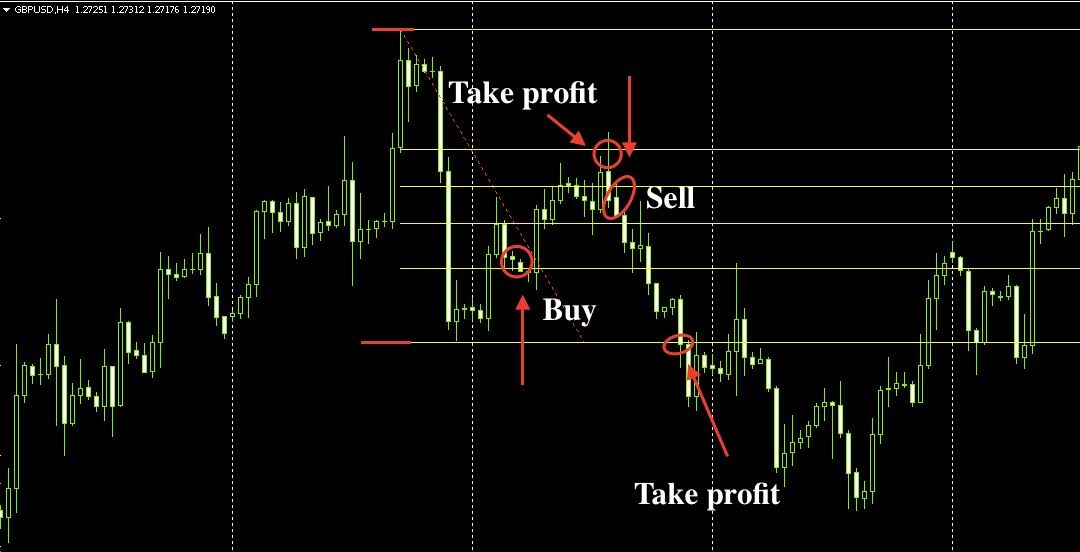
In the screenshot, the highs and lows of the previous week are marked with a red marker. Novice traders are advised to consider trading only when the chart leaves the Fibonacci parabola (range between 23.6 and 61.8). More experienced bidders may consider opening orders inside the parabola. In this case, the levels of 38.2 and 61.8 are mediocre, that is, if the chart has overcome the level of 23.6, then the probability that the price will reach 61.8 when working with a trend and volatile currency pair, such as GBP/USD close to 99%.
In the screenshot presented earlier, the first order is opened exactly after the breakdown level of 23.6 on the Fibonacci grid. As you can see, the forecast fully meets expectations. The next sale is opened after the formation of the Price Action “Bear Rails” pattern near the important level of 61.8. Based on this, you can confidently open a Sell order with a target level of 23.6 or even 0.0. To ensure moderate risks and save profits, you can consider partial closing of the order when the price reaches the first target level.
Important! When trading with this method, the use of the Martingale and averaging methods is unacceptable.
Conclusion
Fibonacci levels in online trading are not just a free add-on to a trading platform. This is a unique and very effective analytical tool, the correct application of which will help to achieve the expected financial result. The strategies considered in the material have been verified by personal experience. It is worth saying that the number of unprofitable transactions is about 10-15%, while the ratio of potential profit to possible loss is 1: 1.


