


Global financial media have reported the "extreme cost" of the US stock market in recent days. In theory, this should be followed by an imminent collapse.
The reason for concern was the P/E forward multiplier of the S&P 500 index. The indicator rose sharply and exceeded 20 over the month. It is not far from the historical maximum of 23.4, which was recorded during the “dotcom bubble” of 2000. Even at the peak of the US market at the beginning of the current year, such forward P/E value was not observed.
What does this mean for investors, and is there any fear of collapse? Let's figure it out.
What is the problem?
Multiplier P/E is the ratio of capitalization and net profit. The simplest approach: the higher the P/E, the “more expensive” the stock or stock index from a fundamental point of view. Like other multiples, it is customary to compare the indicator with peak values, as well as the historical average when evaluating a wide market. Formally, when P/E is close to historical highs, the risks of a market fall increase.
Forward P/E is the ratio of capitalization and forecast for profit for the next 12 months. This is a look into the future. According to the FactSet research organization, on May 7 the forward P/E of the S&P 500 index was 20.4 with a historic high of 23.4 in September 2000 and a 5-year average is 16.7.
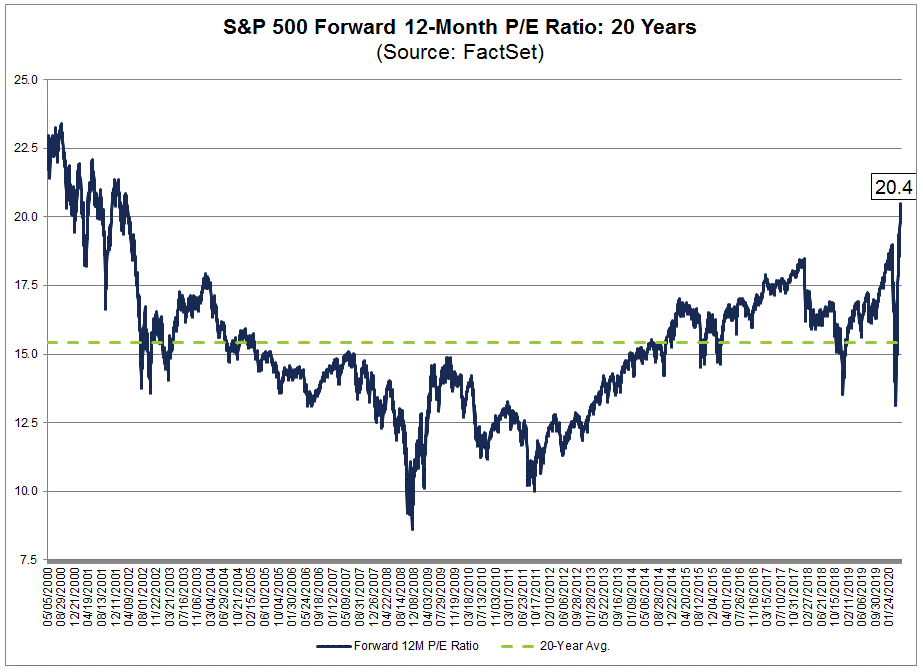
At the low of this year was the multiplier was 13.1 on March 23. Two factors contributed to the increase in forward P/E: an increase in P and a drop in E. From the low of this year, the S&P 500 soared by 30%. It was about 17% to the historical maximum. It turns out that forward P/E is growing much faster than the US market index. Explanation: The denominator E is falling. According to FactSet, the average analysts’ forecast for the consolidated earnings per share (EPS) of the S&P 500 since March 23 decreased by 16.2%.
The average historical correlation between the S&P 500 and the forward P/E is 0.92. With a correlation coefficient equal to 1, the relationship is linear, when one component rises / falls by 1% and the other component also rises / falls by 1%.
For the multiplier to adjust, the S&P 500 should either fall or EPS forecasts should improve. The second is unlikely under current conditions, so there have been concerns among investors that the US stock market may fall again, as it is already too “expensive”. In fact, this point is not so clear, it is worth looking at other factors.
What does other multipliers say?
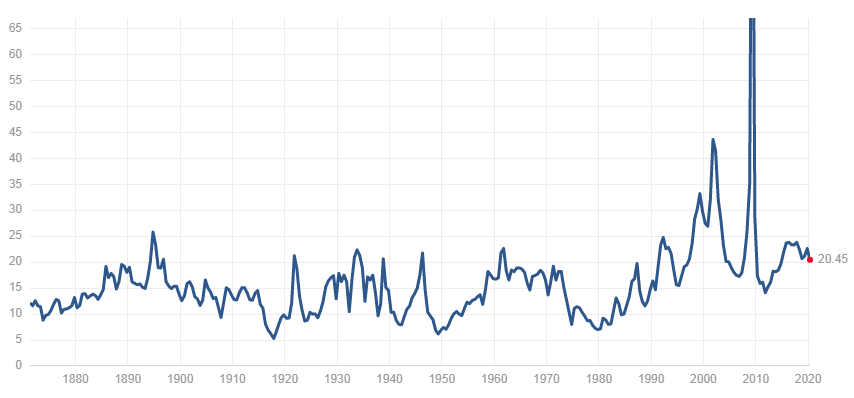
P/E - the usual version of the multiplier - capitalization / profit for the last year. Nothing special is observed: 20.5 with a maximum of 124 in May 2009, a way out of the mortgage crisis), and a median since 1870 is 14.8. You need to understand that the profit margin in this case is late. Compared to 2019, the financial situation of US companies has deteriorated significantly.
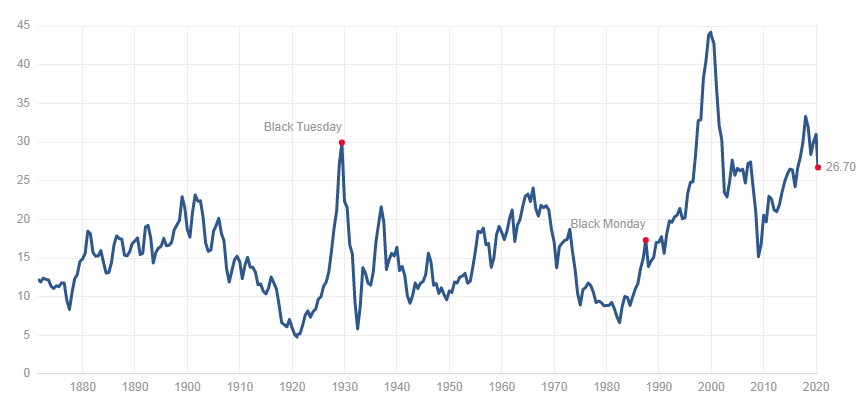
Shiller P/E (CAPE, P / E 10) is the P/E based on the average inflation-adjusted profit for 10 years. It was developed by Nobel laureate Robert Schiller to evaluate the US stock market, specifically the S&P 500. It allows you to smooth out cyclical fluctuations in income.
Here the situation indicates a greater "high cost" of the American market, but it is far from extreme values. Shiller P/E is 26.7 with a maximum of 44.2 in December 1999, during the “dotcom bubble”.
P/S - capitalization / revenue. The indicator is higher than the median for 20 years: 2 against 1.5. However, P/S is noticeably lower than the maximum for the calculation period, the end of 2019, 2.3. The market drawdown smoothed the multiplier.
P/BV - capitalization / book value of equity (assets minus liabilities). The situation is not extreme at all. The multiplier is 3.1 with the maximum times of the “dotcom bubble” in March 2000, it is equal to 5.1.
Please note that in the modern world P/BV is suitable mainly for valuing bank shares. For the dominant sector of high technology, it is of little importance, since IT companies have a high share of intangible assets in the balance sheet structure.
Conclusion 1
Other multipliers do not give signals of threatening. However, forward indicators are the most important now, since the economic situation has seriously changed since 2019. The market lives the future, forecasts are important.
What we did not take into account?
In order not to make hasty conclusions, let's analyze the situation with forward P/E in detail. The main question is how correctly to use historical analogies?
When evaluating stocks, it is customary to evaluate multipliers relative to median, or average, values ​​for a group of comparable companies or competitors. It is necessary to take into account the financial performance of companies. If the company is “expensive” by multiples, but highly profitable, incomes are growing, and the debt burden is moderate, then “high cost” may be justified and may not indicate serious drawdown risks.
When the situation is analyzed from the point of view of historical values, then the change in the economic situation and structural changes are not taken into account.
Technology companies have dominated in recent years. Now they occupy about 25% in the S&P 500. Another 11% falls on the communications services sector, which has been existing for about two years, where Facebook, Alphabet (Google), Netlix have moved.
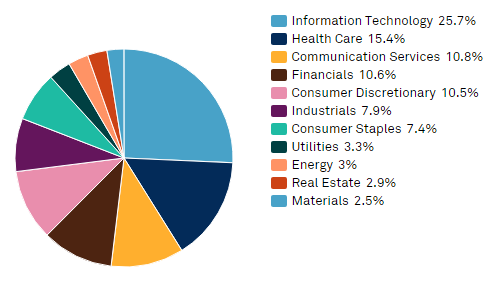
From the beginning of January 2020 to the end of April 2020, the capitalization of the FAAMG group (MSFT, AAPL, AMZN, GOOGL, FB) grew by 10%. At the same time, the remaining 495 companies from S&P 500 lost 13% of their market value. According to Goldman Sachs estimates, the P/E of five companies is 28, with 16 for the remaining S&P 500 companies, taking into account the profit forecast for 2021.
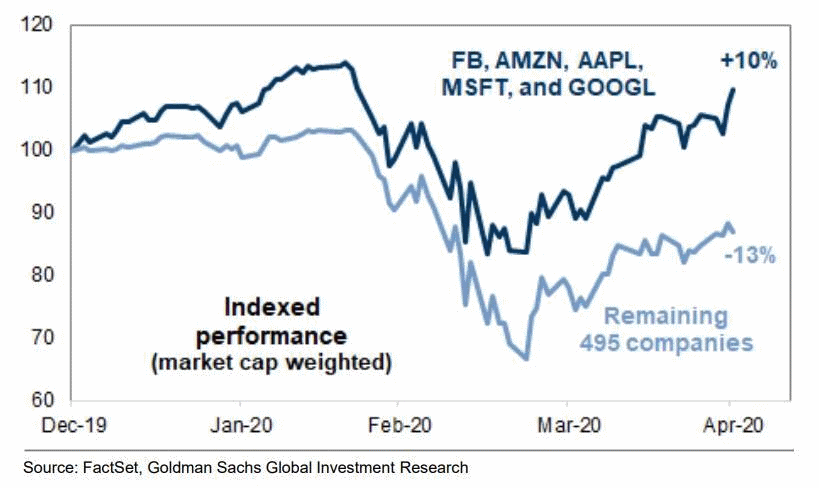
Shares of the IT sector and the communication services segment on average have higher earnings expectations, and therefore higher multiples, than representatives of traditional industries.
General trend
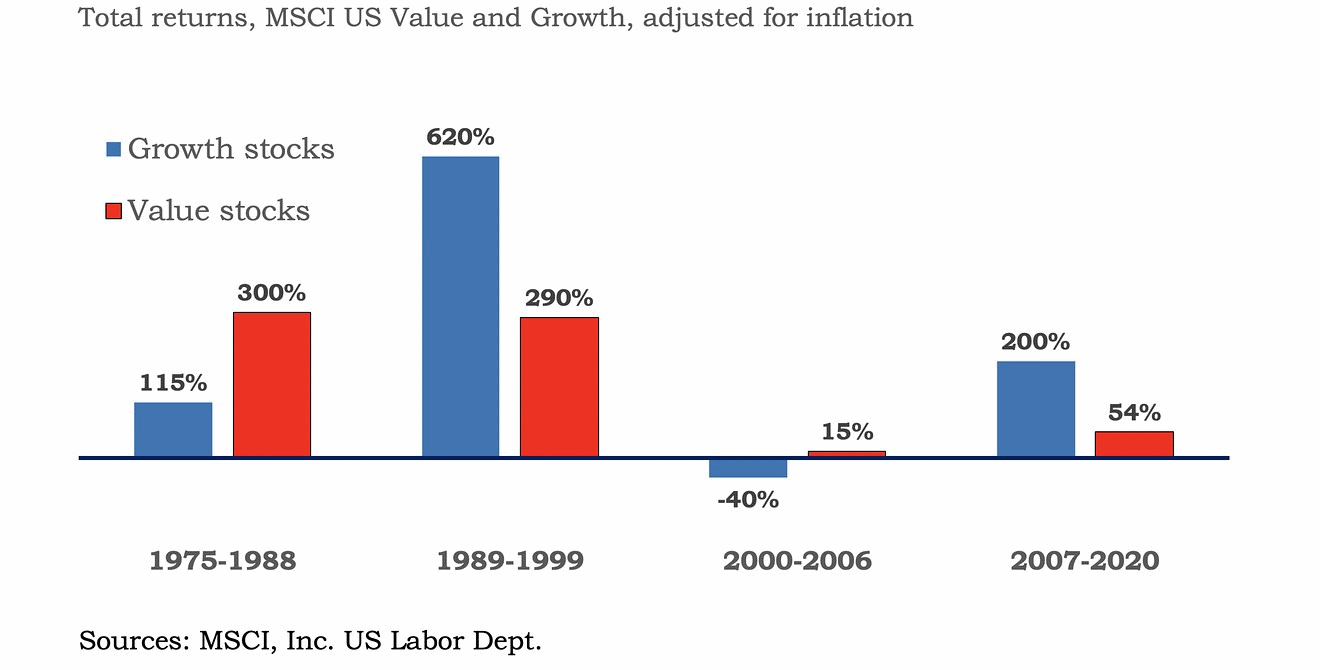
Since 2007, “growth stocks” are noticeably ahead of “cost histories”, the multiples of which are noticeably lower. This is a consequence of a structural shift in the economy, which partly justifies the higher “normal” value of the multipliers.
 ​
​
- Fundamental valuation of shares. There are two basic approaches: valuation by multiples and by models of discounting cash flows (DCF).
- A rough estimate of the multiples: to get the conditionally fair value of the S&P 500 for 12-month target, you need to multiply the usual P/E by the forecast for consolidated earnings per share (EPS) by 12 months. If consolidated profit falls, the target level for the index is likely to indicate a decline in the market in the next 12 months. High due to the low expected EPS, the forward P/E fits perfectly into the overall picture of increased risks.
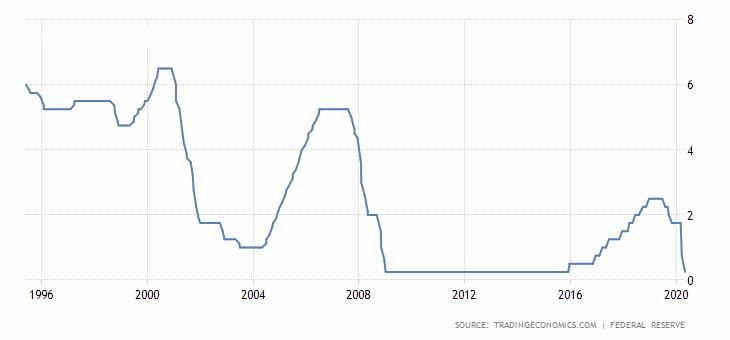
There is one more point. For calculating consensus, a fundamentally sound P/E value can be used. It negatively depends on the level of interest rates. Now the Fed rate is close to zero. Apparently, interest rates in the United States will remain at extremely low levels for a long time to come. This means that now the “normal” P/E is higher than a year ago, when the key Fed rate was 2.25–2.5%. Compared to 15–20 years ago, the situation is even more obvious. Based on this, forward P/E is now high, but the value is not extremely critical.
We turn to the models of discounting cash flows. They are quite complex and can be described for a long time.
Short
According to DCF models, the fair value of shares directly depends on the forecast for cash flows / earnings per share / dividends and negatively on interest rates. We have already talked about low rates. For calculations, the income forecast is taken 5–10 years in advance. At the same time, forward P/E takes into account the forecast for consolidated EPS for only 12 months.
In the long run, the US economy will recover. Corporate earnings will begin to grow. According to the FactSet forecast, in 2020 the consolidated earnings per share of the S&P 500 will decrease by 19.7%, and in 2021 it will grow by 26.9%. Long-term revenue growth is another parameter in DCF models. The higher the expectations, the higher the fair price of the shares. It turns out that the forward P/E does not take this factor into account, and the US market is still not so “expensive”.
Conclusion 2
Based on the assessment models, focusing exclusively on forward P/E is incorrect. The indicator does not take into account interest rates in the economy and long-term expectations on the dynamics of corporate incomes.
What does this mean for investors?
The answer is surprisingly simple: forward P/E in this case does not show anything special!
- Firstly, the multiplier score is instantaneous and crude. The creator of Shiller P/E, Nobel laureate Robert Schiller acknowledged that CAPE does not give the exact moment to enter or exit a position. To do this, it is better to use technical analysis. For other multipliers, everything is similar. Extremely high multiples may indicate increased risks of market drawdowns, but no more. While forward P/E is high, but the levels are not extreme.
- Secondly, the assessment of historical analogies ignores structural changes in the economy. At the same time, the use of forward multipliers does not take into account the recovery of the American economy, and hence the income of corporations, in the long term. This underestimates the potential growth potential of the market.
Locally, the likelihood of a new wave of decline in the US stock market is quite high, but this is hardly a harbinger of the "apocalypse." The S&P 500 added about 30% from the March low. Current levels are still high for current economic conditions. Immediate support for the S&P 500 is 2700 points, an important resistance is 2950 points. In the medium term, we consider approximately 2550 points as a target.
All things being equal, an update to the S&P index of 500 lows this year is less likely.
Fiscal and monetary stimulus can support the economy and enterprises, and hence the American stock market. The US leadership has already injected more than $3 trillion into the US economy, and the Fed has essentially announced unlimited QE. Apparently, this is not the limit. While the situation around the coronavirus COVID-19 pandemic is not completely predictable, we will therefore leave it as a “gray swan”, a risk factor for the forecast.
TOP3 US stock for current week
This week will be interesting for the American stock market. The S&P 500 index wanders around a strong level of 2950 points, and new movements are just around the corner.
Alibaba Group (BABA)
Alibaba Group released quarterly reports last Friday. The results were better than the consensus analysts’ forecast. The company noted that the situation in its business has been gradually recovering since March 2020, trade turnover on marketplaces has returned to the pre-crisis level. Quarterly revenue in e-commerce increased by 19%, in the field of "cloud" technologies - by more than 58%.
Despite the positive report, Alibaba ADR during the bidding failed by 6%. This is due to increased risks associated with the confrontation between the US and China. Donald Trump is trying to earn political points by shifting focus from the sharp increase in unemployment in the United States to an “external enemy”. Last Wednesday, the Senate approved a bill that could ban many Chinese companies from listing on US exchanges or raising money from US investors.
Alibaba stocks failed within the upward channel of a year and a half before reaching a historic high. ADRs are currently trading at around $199. Immediate support is $ 195, which hosts the 200-day moving average. If the decline is deeper, which is likely, the next reference will be the zone of $188-184, where the horizontal level and the lower boundary of the channel pass. The long-term view of Alibaba is positive.
Baidu (BIDU)
The Chinese risks have affected these stocks even more strongly. According to a Reuters report, Baidu is considering delisting with the NASDAQ and moving to an exchange closer to China. The owner of the Chinese search engine wants to increase capitalization. Growing tensions between the US and China may prevent this.
Last Tuesday, BIDU soared after the publication of quarterly reports. The stocks reached strong resistance of $120 and fell off from this level. Messages about a possible delisting led to a further drawdown of BIDU. Last Friday, the stocks lost 6% and traded in the region of $103. They can find support around $95. The next level is formed by the lows of this year - $85-83.
The situation with delisting is not yet fully clear. If Baidu remains on the NASDAQ, then it is likely that the papers will return to the area of ​​$140-150 within 12-18 months.
NVIDIA (NVDA)
Shares of the manufacturer of video cards NVIDIA added about 3% last Friday. At the beginning of trading, the stocks resisted $364. This is the level of projection of Fibonacci from the previous wave of growth, completed in February. Later stocks rolled back to the $361 area
The company submitted quarterly reports recently. The results were slightly better than analysts' consensus forecasts. Strong performance was observed in segments related to the production of solutions for data centers and video games.
NVIDIA stocks doubled its price from March 2020 lows. Now they look overbought. Some investment houses raised their benchmarks for these securities after the publication of financial statements. 12-month consensus target is $390. Apparently, this can be taken as a conditional benchmark in case of consolidation of shares above $364. On the pullback, immediate support is the recent gap zone $350-340. The next technical level is $317.


