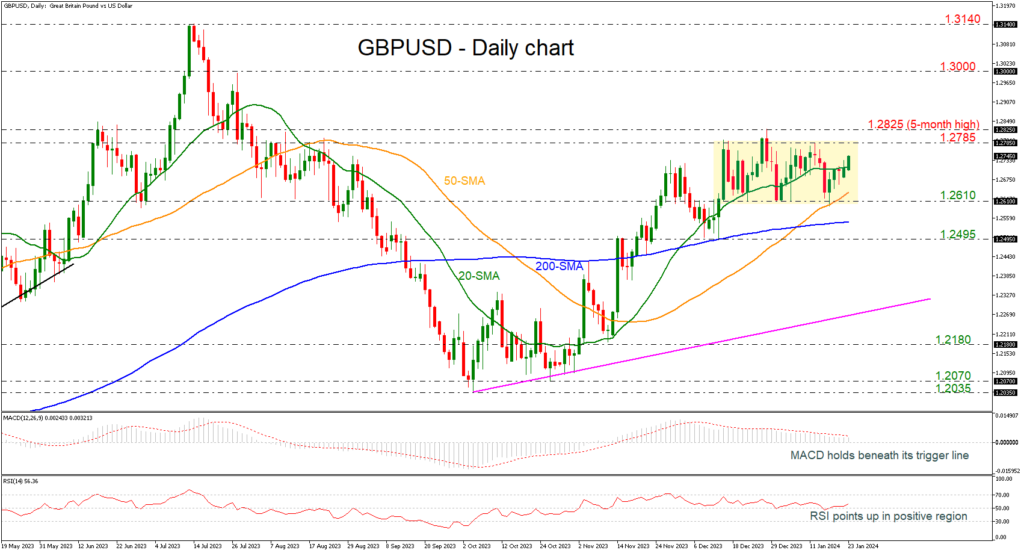
The GBPUSD currency pair has recently exhibited resilience, edging higher within its established trading range of 1.2610-1.2785. This price action marks a reversal from the lower boundary of the range, with the pair now advancing beyond the 20-day Simple Moving Average (SMA) and approaching its previous highs. Mixed Momentum Indicators: While the overall picture appears positive, it's important to note some mixed signals from momentum indicators. The Moving Average Convergence Divergence (MACD) still lacks upward momentum, remaining below its trigger line within the positive region. On the other hand, the Relative Strength Index (RSI) is pointing upwards from the bullish area, following a period of flattening.
Key Resistance Levels Ahead
Should GBPUSD sustain its positive momentum, the next significant resistance zone lies within the range of 1.2785-1.2825. A successful breach of this level would not only shift the bias to a more bullish one but also pave the way towards the psychologically significant level of 1.3000. However, if the currency pair fails to break above the upper boundary of the range in the coming sessions, the risk could tilt back towards the downside. In such a scenario, traders should closely monitor the 50-day SMA at 1.2635, which may act as a support level, along with the lower limit of the trading range at 1.2610. Further downside pressure could lead to a test of the 200-day SMA at 1.2545, followed by the 1.2495 support level.

Medium-Term Outlook Remains Positive: In the medium term, the overall outlook remains bullish. This optimism is supported by the fact that prices are holding above all key moving average lines and adhering to an ascending trend line that has been in place since October 4th. These factors collectively suggest that GBPUSD maintains a solid foundation for potential future gains.


