HFM information and reviews
HFM
96%
FXCC information and reviews
FXCC
92%
FxPro information and reviews
FxPro
89%
XM information and reviews
XM
86%
Exness information and reviews
Exness
86%
FP Markets information and reviews
FP Markets
81%

Predicting a Forex Market Direction


How to Predict a Forex Market Direction with Technical Analysis?


Forex market is changing, and changing cyclically. It means that usually there are such situations on Forex when the price behaviour becomes as predictable as possible. And if we can predict the price, then we can earn on the market. One question remains: on what basis can we predict the movement of the market?

What is technical analysis?


And here we comes to the technical analysis. JustForex team is helping you to look into that manner. Technical analysis is the prediction of price movements based on the analysis of the historical movement of the price chart. The basic principles of technical analysis were published by Charles Dow in a series of articles in The Wall Street Journal, 1900-1902. And although it was based on observations of the stock market, the theory he created works fine on the Forex market. The basic are three postulates:

  1. Market (price) takes into account everything. In the current quotation and market movement, all tendencies, sentiment of participants and other factors that may influence the formation of the current price are already taken into account.
  2. History repeats. Dow’s observations have shown that market formations, such as the alternation of peaks and lows, are relatively stable and tend to repeat over time.
  3. Price trends are constantly present and complement each other. The price does not move in a random way, and at each moment of time, there is a prevailing movement: up, down or sideways.

Based on this, we can conclude that technical analysis is the universal means for predicting prices in the future.

So how to apply technical analysis to predict the price direction?

From theory to practice. There are many tools for predicting prices using technical analysis. But we wanted to draw your attention to the most popular and effective technical analysis instruments.

Linear tools


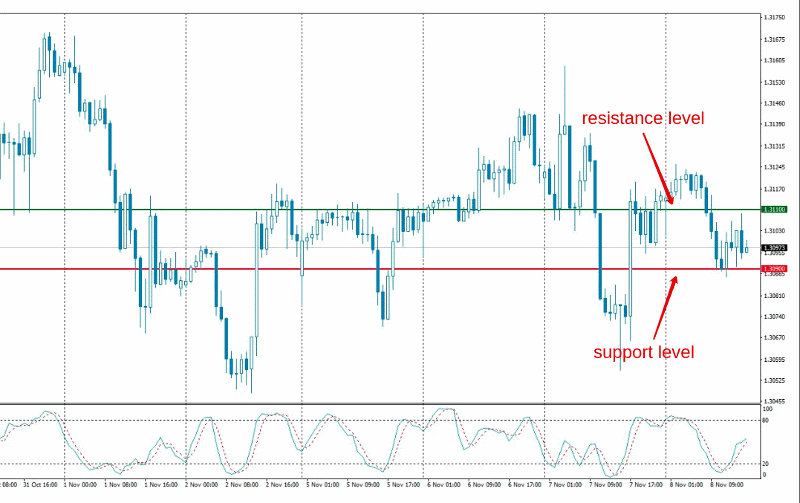
Linear technical analysis tools are represented by a set of lines: vertical, horizontal and trend. Vertical lines serve as a good guide to the beginning of a new trading session and mark the release of critical news reports. Horizontal lines allow you to draw the trend price channel (support and resistance lines). Breaking these levels is usually a sign of a trend change in the Forex market. Trend lines allow assessing the current trend.

In the graph below, we show support and resistance levels using the red and green lines:

Indicators


It is a universal tool that allows you not only to automatically build various lines, waves and levels on a currency pair chart, but also determines necessary parameters such as market condition, the direction and strength of the trend, and even alerts you to the upcoming reversal.

Indicators can be considered as the primary tools for technical analysis. Based on the recommendations of the professionals, the most effective are: Moving Average, Bollinger Bands, Stochastic Oscillator, MACD histogram, RSI.

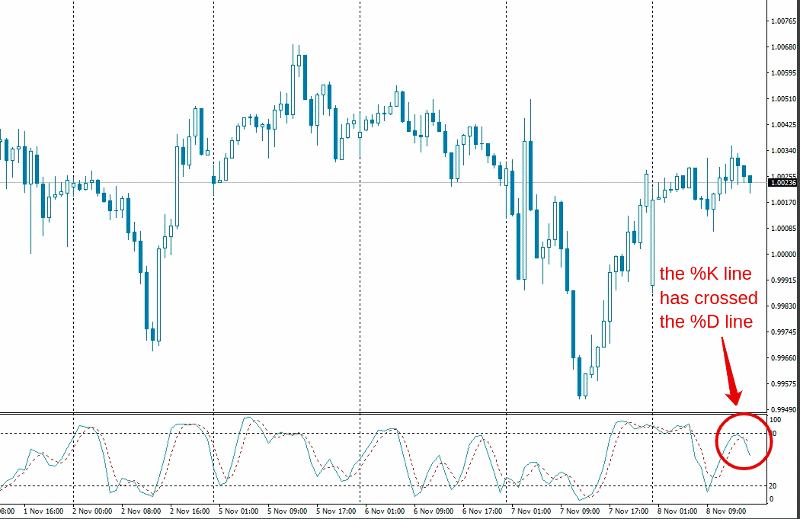
Let's look at an example: how Stochastic Oscillator works. It is located below the graph and consists of two curved lines: the %K line (solid one) and the %D line (dashed one), which move up and down within the vertical scale from 0 to 100%. From levels 20 and 80 there are two horizontal levels, below and above which oversold and overbought zones, respectively, are located.

The main signal to enter the market is the intersection of the %K and %D lines. So, if the solid line crosses the dashed one from the bottom up, then you need to open a buy order, if from top to bottom - a sell order. In the chart below, we see that the %K has crossed the %D line from top to bottom, and this is an excellent signal to open a short position.

It is the simplest example of using indicators. Each of them has many signals and applications. JustForex team recommends you to learn how to apply them before putting into practice.

Technical analysis patterns


Technical analysis patterns or chart patterns gives a possibility to analyze and supplement your analysis qualitatively. As you know, charts of currency pairs follow certain trends. So with the help of patterns, it is possible to predict both the continuation of the trend and its reversal.

As a rule, ten basic figures of technical analysis are applied: Triangle, Head and Shoulders, Double Top, Wedge, Triple Bottom, Triple Top, Double Bottom, Flag, Rounding Bottom, Pennant. For each of them, there are rules for entering the market.

Let's look at the example of Triple Top. Triple Top is a figure of technical analysis of financial markets, including the Forex market, which is formed after a long uptrend and indicates a possible reversal of the trend.

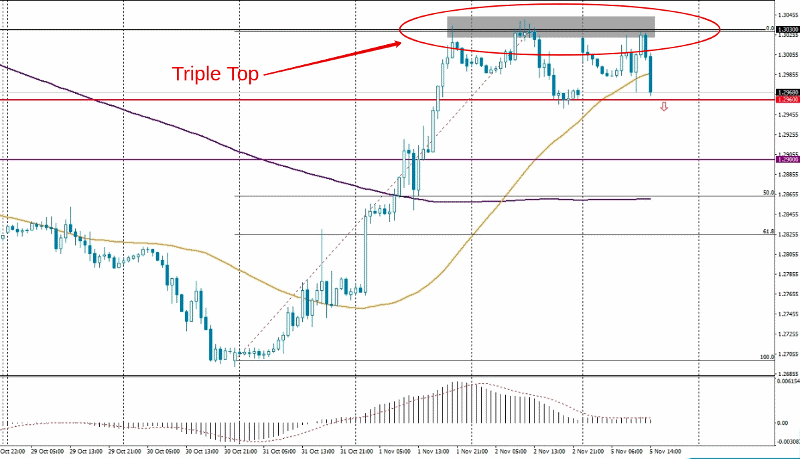
If the price falls below the support level (a particular deviation is acceptable), the formation of the model is considered complete. A sell signal appears, and the trend direction is expected to change. So, as you can see, technical analysis presents plenty of ways how to use its tools in practice and predict price movements. All is in your hands.

Prepared by JustForex

#source


RELATED

What Is A Short Position?

In exchanges, one earns not only on the rise but also on the collapse of quotes. This amazing strategy is used by "bears" - traders who make money on the "sinking" of securities and other assets...

What Are Market Trends?

Have you ever wondered what a market trend is and how to spot it? If so, this article is what you need. A market trend refers to the general direction in which a particular market or asset moves over time...

To Become a Great Trader, You Must Avoid These 18 Trading Mistakes

Have you ever wondered what helped all those professionals of Wall Street become successful? You will be surprised, but the key to their reached heights is hidden in their mistakes...

Stock Buybacks: Why Do Companies Buy Back Shares?

In recent years, buyback programs have become one of the growth drivers of U.S. stock markets, creating demand and reducing supply. Corporations have proved to be quite prominent buyers...

Why do people use MetaTrader 4?

MetaTrader 4 is a powerful tool for traders of all levels. Find out why so many people rely on it to power their trading success...

A Guide to Portfolio Diversification: Don’t Put All Your Eggs in One Basket

Most of us have heard of the saying "Don’t put all your eggs in one basket". In essence, this phrase warns us not to invest all our capital into a single trade, market, or product because we...

Unlocking the Potential of Real World Assets (RWAs) in Crypto

The world of finance is witnessing a transformative revolution with the advent of real world asset tokenization, or RWAs, in the cryptocurrency space. Imagine having the opportunity to own a fraction...

Black Swan Event: Definition And Examples

The black swan is difficult and sometimes impossible, to predict. And yet, if the markets are falling, it means that someone has started to sell. It means that someone...

Unraveling High-Frequency Trading Systems for Novices

High-frequency trading, abbreviated as HFT, is a trading style that utilizes advanced algorithms for rapid transaction execution. This article breaks down the intricacies of HFT...

Ten Forex Trading Tips for 2023

The foreign exchange (forex) market is the largest and most liquid financial market in the world, with a turnover of more than USD 5 trillion every day...

Choosing a broker to trade the financial markets

Choosing a broker to help you navigate the financial markets is an important decision that can significantly impact your trading experience. There are several key factors...

Comprehensive Guide to the Top Copy Trading Platforms in 2023

Copy trading is gaining traction among traders as an innovative way to leverage the expertise of seasoned players in the financial market. By mirroring the trades of successful traders...

The Evolution of Modern Investment Methods: An Exploration of Copy Trading and PAMM Services

Investment methodologies have traversed an intricate journey, and in today's digitized world, they've undergone a significant transformation. The ubiquity of the internet and cutting-edge computer technologies...

The Power of Crypto Trading Signals: A Comprehensive Guide for 2023

Introduction to Crypto Trading Signals Venturing into the world of cryptocurrencies can be daunting, especially with its volatile nature. However, traders both novice and experienced have a secret weapon...

Why traders shouldn’t underestimate an Economic Calendar

Brace yourselves for the ultimate weapon in your trading arsenal - an Economic Calendar, revealing the future of financial markets. So, why should you care?

Pegging in Crypto: Navigating Stability in the Digital Asset World

In the ever-evolving world of Cryptocurrencies, understanding the nuances of terms like “pegging” is crucial. Pegging in the realm of Crypto refers to anchoring the value of a digital asset to another asset or a basket of assets...

What Is Economic Growth And What Does It Have To Do With Inflation?

If a country's economy is growing, it means its citizens' standard of living is also growing. Or does it? Let's find out what gross domestic product is, how it relates to economic growth and living standards..

Comprehensive Guide to Gold Trading: Strategies and Considerations

Gold, with its intrinsic allure and historical significance, has captivated humanity for centuries. From adorning jewelry to serving as currency, gold's rarity and lustrous beauty...

Mastering Bond Trading in 2023: Strategies and Insights

Bonds, often known as fixed income securities, remain a fundamental financial instrument for both governments and corporations, allowing them to raise capital for various projects and operations...

Navigating the Commodities Market: A Comprehensive Insight into Recent Trends

In the intricate web of global markets where economic fluctuations resonate across borders, the art and science of trading commodities have unfolded into multidimensional realms...

IronFX information and reviews
IronFX
77%
AMarkets information and reviews
AMarkets
76%
Just2Trade information and reviews
Just2Trade
76%
T4Trade information and reviews
T4Trade
75%
Riverquode information and reviews
Riverquode
75%
FXCess information and reviews
FXCess
75%

© 2006-2026 Forex-Ratings.com

The usage of this website constitutes acceptance of the following legal information.
Any contracts of financial instruments offered to conclude bear high risks and may result in the full loss of the deposited funds. Prior to making transactions one should get acquainted with the risks to which they relate. All the information featured on the website (reviews, brokers' news, comments, analysis, quotes, forecasts or other information materials provided by Forex Ratings, as well as information provided by the partners), including graphical information about the forex companies, brokers and dealing desks, is intended solely for informational purposes, is not a means of advertising them, and doesn't imply direct instructions for investing. Forex Ratings shall not be liable for any loss, including unlimited loss of funds, which may arise directly or indirectly from the usage of this information. The editorial staff of the website does not bear any responsibility whatsoever for the content of the comments or reviews made by the site users about the forex companies. The entire responsibility for the contents rests with the commentators. Reprint of the materials is available only with the permission of the editorial staff.
We use cookies to improve your experience and to make your stay with us more comfortable. By using Forex-Ratings.com website you agree to the cookies policy.