In the ever-evolving realm of financial markets, gaining a deep understanding of various tools and indicators is essential for deciphering price trends and making informed decisions. Among these tools, the 50-day moving average (50-day MA) stands as a fundamental yet powerful concept. In this comprehensive article, we will delve into the world of the 50-day moving average and its diverse applications in trading and investment strategies. Whether you're a seasoned trader or just beginning your financial journey, mastering the intricacies of the 50-day moving average can provide a valuable edge in navigating the market's complexities. Join us as we explore the intricacies, benefits, and practical applications of this versatile indicator in the context of 2023's ever-evolving financial landscape.
Understanding Moving Averages
A moving average is a widely used statistical calculation in data analysis and time series forecasting. It serves as a technique to smooth out fluctuations and noise in datasets, facilitating the identification of trends and patterns over time. The fundamental concept of a moving average entails calculating the average of a set of data points within a specified window or interval and then moving that window along the dataset to calculate averages at different points. This sliding window approach yields a series of average values, offering a clearer representation of underlying trends in the data.
Moving averages find applications across various fields, including finance, economics, engineering, and data analysis. They excel at filtering short-term noise in financial data, identifying trends, and forming indicators for technical analysis. Shorter-term moving averages respond rapidly to price changes, while longer-term moving averages present a smoother view of long-term trends.
Traders and analysts often use crossovers between different moving averages, such as the 50-day and 200-day moving averages, as signals for potential trend changes or market entry/exit points. Furthermore, moving averages lay the foundation for complex forecasting models and statistical analyses.
Types of Moving Averages
Several types of moving averages exist, each with its unique characteristics and applications. Here are some common types:
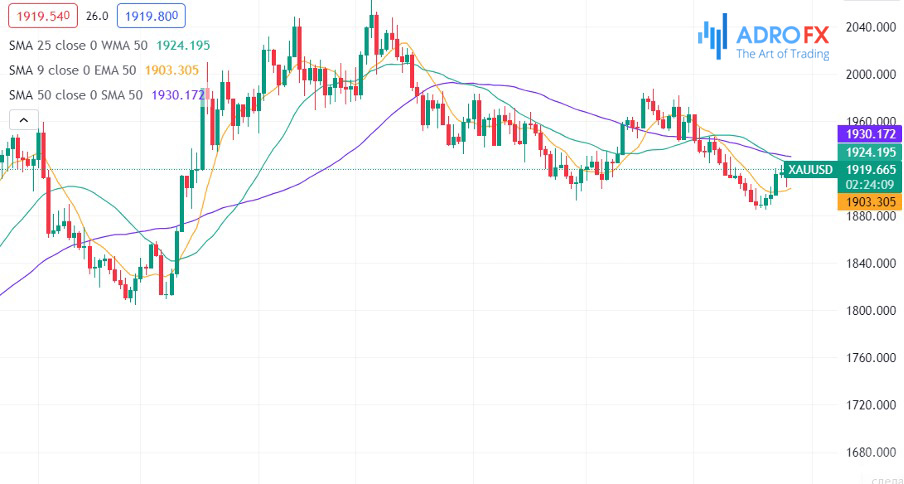
- Simple Moving Average (SMA): This basic type of moving average calculates the average of a fixed number of data points within a specified time period. Each data point in the window contributes equally to the calculation, making SMAs easy to understand and providing a straightforward representation of trends.
- Exponential Moving Average (EMA): EMAs assign more weight to recent data points compared to older ones, making them more responsive to recent price changes and trends. Traders frequently use EMAs for identifying short-term price movements.
- Weighted Moving Average (WMA): WMAs assign different weights to data points within the window, typically with higher weights for more recent data. This type seeks to balance the responsiveness of EMAs and the smoothness of SMAs.
- Smoothed Moving Average (SMMA): SMMA is a variation of the simple moving average that applies a smoothing technique to reduce the impact of abrupt price changes. It assigns a weight to each data point and calculates the moving average based on the weighted sum of data points.
- Hull Moving Average (HMA): HMAs aim to reduce lag and noise by employing weighted moving averages of different time periods. This results in a smoother moving average that responds more quickly to price changes compared to traditional SMAs or EMAs.
- Double Exponential Moving Average (DEMA): DEMA eliminates lag by applying a double smoothing process to the price data. It combines two exponential moving averages for a more responsive moving average line.
- Triple Exponential Moving Average (TEMA): TEMA further enhances DEMA by using a triple smoothing process. This type of moving average aims to provide even more responsiveness and less lag.
- Volume Weighted Moving Average (VWMA): VWMA incorporates trading volume in addition to price data. Weights are assigned based on trading volume, giving more importance to periods with higher activity.
- Kaufman's Adaptive Moving Average (KAMA): KAMA adjusts its sensitivity based on market volatility, offering a moving average that responds more during high volatility and remains smooth during low volatility.
The choice of moving average depends on the specific analysis goals, data characteristics, and the desired balance between responsiveness and smoothness. Traders and analysts often experiment with various moving averages to find the one that best suits their needs.
The 50-Day Moving Average: What Is It?
The 50-day moving average (50-day MA) is a specific type of moving average widely used in technical analysis, especially in financial markets. It is calculated by taking the average of a security's closing prices over a 50-trading-day period. Each day, the oldest data point is replaced with the most recent day's closing price, and the average is recalculated.
The 50-day moving average serves as a short- to medium-term trend indicator with several key applications:
- Trend Identification: The 50-day MA is a valuable tool for identifying trends. When a security's price consistently trades above its 50-day moving average, it is often interpreted as a bullish trend, indicating upward momentum. Conversely, when the price is consistently below the 50-day MA, it can be seen as a bearish signal, suggesting recent downward price movement.
- Support and Resistance: The 50-day moving average can act as a support level during upward trends and a resistance level during downward trends. When prices approach the 50-day MA from below and find support, it can be seen as a potential buying opportunity. Conversely, when prices approach the 50-day MA from above and encounter resistance, it can indicate a potential selling opportunity.
- Crossovers: Traders closely monitor crossovers between the 50-day moving average and longer-term moving averages, such as the 200-day moving average. When the 50-day MA crosses above the 200-day MA, it's known as a "Golden Cross" and can be interpreted as a bullish signal for the overall trend. Conversely, when the 50-day MA crosses below the 200-day MA, it's called a "Death Cross" and can be seen as a bearish signal.
- Volatility and Momentum: Rapid price changes can lead to fluctuations in the 50-day moving average. Sudden price movements cause the moving average to react quickly, reflecting changes in short-term momentum and volatility.
The choice of the 50-day moving average is somewhat arbitrary and depends on the specific analysis's context and time horizon. Shorter-term moving averages, like the 50-day MA, respond rapidly to recent price changes, making them suitable for identifying shorter-term trends. Traders often use the 50-day moving average in combination with other technical indicators and tools to make more informed decisions about trading strategies.
The 50-Day Moving Average Trading Strategy
The 50-day moving average (50-day MA) trading strategy is a popular approach among traders to identify trends and potential trading opportunities. This strategy relies on the interaction between the price of an asset and its 50-day moving average. Here's how the strategy works:
Identifying the Trend: The strategy's first step is to determine the trend's direction. This is usually done by observing whether the price is currently trading above or below the 50-day moving average.
- Bullish Trend: If the price consistently remains above the 50-day MA, it's considered a bullish trend, indicating upward momentum.
- Bearish Trend: If the price consistently stays below the 50-day MA, it's considered a bearish trend, indicating downward momentum.
Entry and Exit Signals: The 50-day MA strategy generates entry and exit signals based on crossovers between the price and the moving average. Two common types of crossovers are:
- Golden Cross: This occurs when the price crosses above the 50-day MA, suggesting a potential reversal from a bearish to a bullish trend. Traders often interpret this as a buy signal.
- Death Cross: This occurs when the price crosses below the 50-day MA, suggesting a potential reversal from a bullish to a bearish trend. Traders often interpret this as a sell signal.
Setting Stop Loss and Take Profit Levels: To manage risk effectively, traders using this strategy often set Stop Loss and Take Profit levels. A Stop Loss is a predetermined price level at which a trade will be automatically closed to limit potential losses. A Take Profit level is a price target at which a trade will be closed to lock in profits.
- Risk Management: As with any trading strategy, risk management is crucial. Traders should only risk a small portion of their capital on each trade and avoid overleveraging. Using proper risk-reward ratios and position sizing is essential for long-term success.
- Backtesting and Analysis: Before implementing the strategy in live trading, it's important to conduct thorough backtesting on historical data to assess its effectiveness. This helps identify potential strengths and weaknesses of the strategy.
- Monitoring and Adjustments: Market conditions can change, and strategies may require adjustments over time. Traders should continuously monitor their trades, adapt to changing trends, and refine their strategy as needed.
It's essential to note that while the 50-day moving average strategy can be effective, no strategy guarantees profits, and trading carries inherent risks. Traders should consider their risk tolerance, market knowledge, and experience before implementing any trading strategy. Additionally, combining the 50-day MA strategy with other technical indicators or fundamental analysis can provide a more comprehensive approach to decision-making.
Conclusion
In the dynamic landscape of financial markets in 2023, understanding key tools is crucial for successful trading. The 50-day moving average, a versatile and powerful indicator, offers valuable insights into market trends and aids in making informed decisions. Whether you're a novice or an experienced trader, mastering the 50-day moving average provides a competitive edge. From identifying trends to spotting entry and exit points, its applications are evident.
However, it's essential to remember that while the 50-day moving average is a valuable tool, trading success requires more than just one indicator. Comprehensive technical analysis, robust risk management, and a deep understanding of market dynamics are crucial components. By integrating these factors, traders can harness the potential of the 50-day moving average to navigate the complexities of financial markets in 2023 with greater confidence and precision.