


Studying the Forex market, it is easy to notice that the price movement on it occurs in waves. For decades many traders have been trying to find patterns of this movement in order to predict it. This is no coincidence, since Forex waves allow you to see the whole picture of the market and not focus on insignificant local price fluctuations.
One of the most popular graphical methods of analysis is Elliott Wave. This method allows you to evaluate the behavior of market participants, based on the basic postulates formulated in the 20th century.
Elliott Theory
The basis of the Ralph Elliott’s concept is the statement that any price trend can be divided into certain basic components (waves), which are repeated from time to time. Some waves move in the same direction as the main trend, others represent a correction in relation to them.
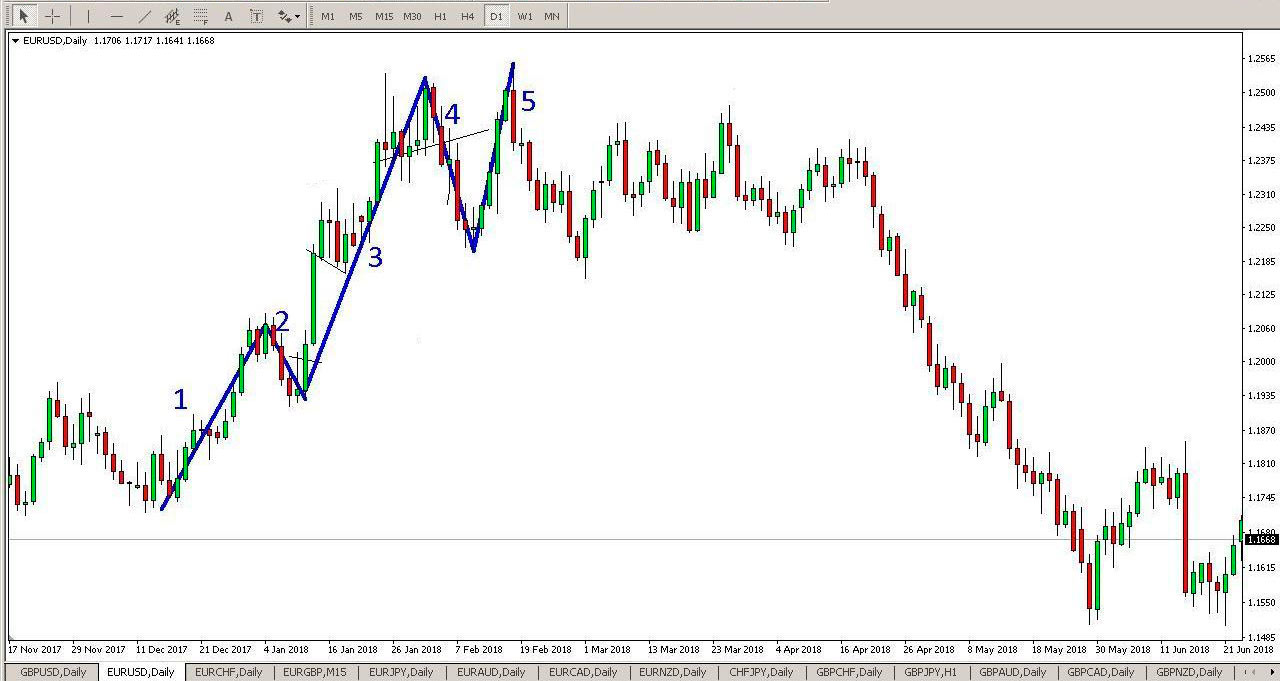
In the view of the Elliott Wave Theory, the entire market is changing according to this pattern. The figure clearly shows the impulse pattern for an uptrend. Waves numbered from 1 to 5 are called pulses.
The founder of the theory explained that this is how the emotional and psychological state of traders is reflected.
This condition can be described in more detail:
- The 1st wave impulse expresses the emotional mood of traders who have decided to buy an asset, because a favorable moment has come in their opinion.
- The next impulse is corrective, because traders make a decision to exit the market. At the same time, there is no update of the lower lows, and the price, before reaching them, unfolds.
- Wave No. 3 is the strongest and longest. A significant part of traders decides to enter into a purchase transaction.
- Some traders decide to exit the transaction, fixing their profits. However, the rest are waiting for further price growth, so the rollback is insignificant.
- The 5th stage is a wave peak. Most participants close buy orders. The rest still hope for continued growth, but this is just an illusion, since nothing continues endlessly.
The main waves are often called acting, correctional are called opposing. A wave analysis of the Forex market only suggests that with a high degree of probability the price movement will occur according to the above scheme, however, one hundred percent guarantee of this scenario development cannot be given. The theory is applicable on any timeframes, but it is more effective on long time intervals.
The list of basic theory rules
To visually identify five areas on the chart of any asset, you do not need to have a lot of trading experience. However, when analyzing the same trend, two traders can come up with completely different results.
To eliminate possible errors in the wave analysis, the basic rules for the formation of waves are specially developed:
- The second wave must necessarily be above the initial point of formation of the first. Otherwise, the development of the trend is not considered confirmed.
- Wave No. 3 without fail exceeds the extremum of the second, and its length exceeds the length of both the 1st and 2nd waves.
- The 4th Elliott Wave is above the extremum of the 1st.
- The 5th extremum is higher than the 3rd extremum.
Additional information for traders is that corrective movements differ in complexity or formation time. Otherwise, the formation of a trend is doubtful.
Varieties of correctional waves
Following impulses, Elliott correctional waves necessarily follow, which are already correcting the further movement of the main trend. For clarity, they are designated A, B, and C.
The creator of the theory has classified more than twenty of their varieties. However, all these wave changes can be represented by three models: “Zigzag”, “Side” and “Triangle”.
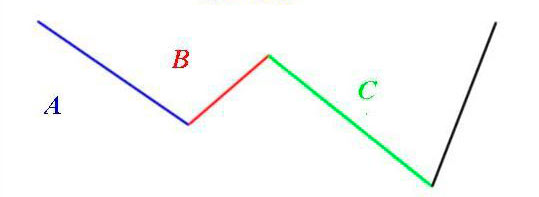
In the Zigzag model, there is a certain inclination of the price movement down: a fall is quite pronounced.
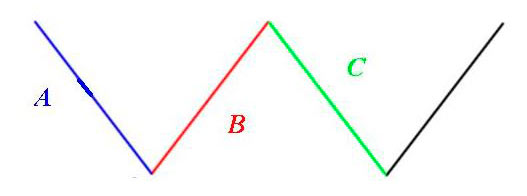
Here the trend movement is carried out in the lateral range.
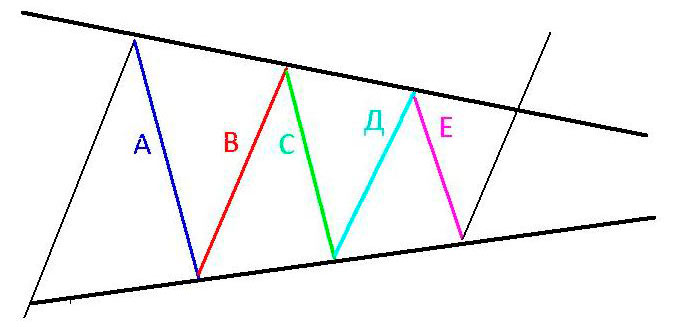
In this case, there is a price movement in an inclined side channel resembling a triangle in shape.
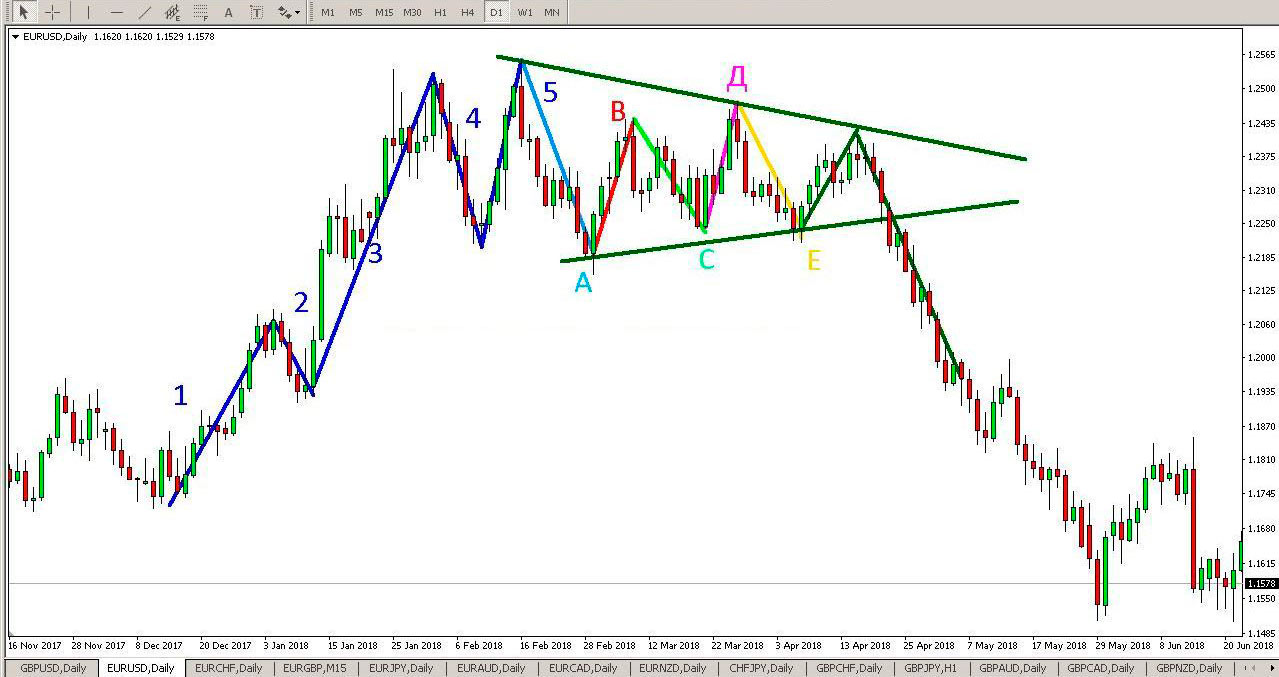
On the EUR/USD chart, this correctional pattern in the form of a triangle is quite clearly visible.
Fractal structure
According to the wave analysis of the Forex market, all waves are fractals. In other words, inside each of them other waves, smaller in size, are hiding. This becomes apparent when switching to lower timeframes.
The founder of the theory distinguished nine levels in the trend development cycle:
- The Great Super Cycle, it is also called the Main or Century. It is 200 years old.
- The Super Level, or Super Cycle, lasts from 40 to 70 years.
- Loop or Main Level. Its length is several years.
- Primary, lasting from several months to several years.
- Average. Its duration is from several weeks to several months.
- Minor or Secondary. Lasts weeks.
- Minute. It takes a few days.
- Little. Duration of a few hours.
- Ultra-small. It is calculated in minutes.
Elliott wave analysis provides special notation for a better understanding of cycles. Waves following the trend are marked with numbers on the charts, corrections - with Latin letters.
In order to more clearly represent the nested waves, the larger ones are denoted in capital letters and large numbers, the smaller ones - in capital letters.
Practical tips
In the theory of Elliott waves, a lot of things seem incomprehensible and complex at first. Sometimes you need to spend several months, and maybe even years for training in wave analysis of the Forex market. A detailed study requires considerable mental effort. However, in practice, three simple rules can initially be applied:
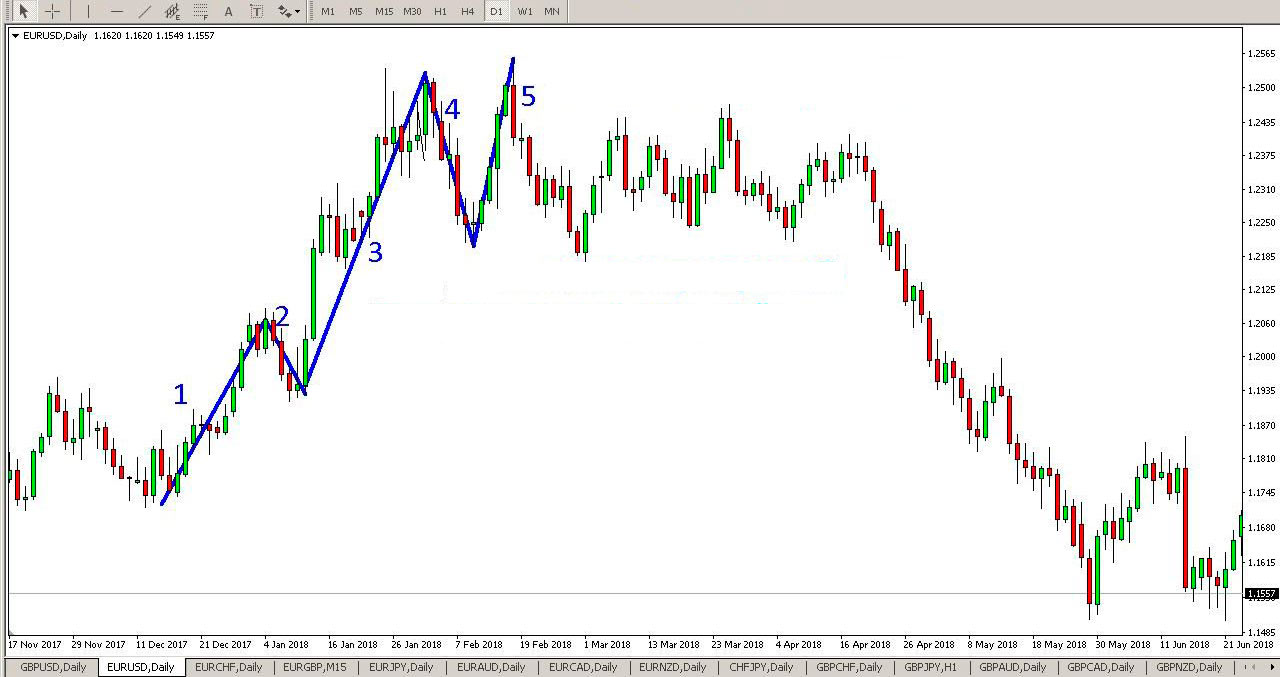
- If wave number 3 is greater than the 1st and 5th, then the latter should have almost equal length, which is clearly observed in the figure. This rule helps to determine the completion of wave number 5.
- The sizes of the 2nd and 4th are different and will alternate from time to time. For example, the first strong correction (wave No. 2) means that the subsequent (wave No. 4) will be insignificant. Or vice versa. Therefore, these waves are often called mirrored. This rule helps determine the 4th wave correction.
- Corrective movement A, B, C usually ends at the same level where wave number 4 ended.
Wave analysis in practice
At Forex, wave analysis is easier to learn using high volatility asset charts. One such currency pair is EUR/AUD. When viewing the graph visually, you should determine the trend and substitute it under the wave model. Then, it is already possible to identify more accurately which wave the price is currently at. Subsequently, it is much easier to predict a trend change and use it to make effective transactions.
It is quite problematic to determine the beginning of the first wave for an inexperienced trader. Fundamental factors should be considered here. They contribute to the emergence of a new trend movement. However, if the first two waves have already formed on the chart, it is much easier to determine the subsequent Elliott model.
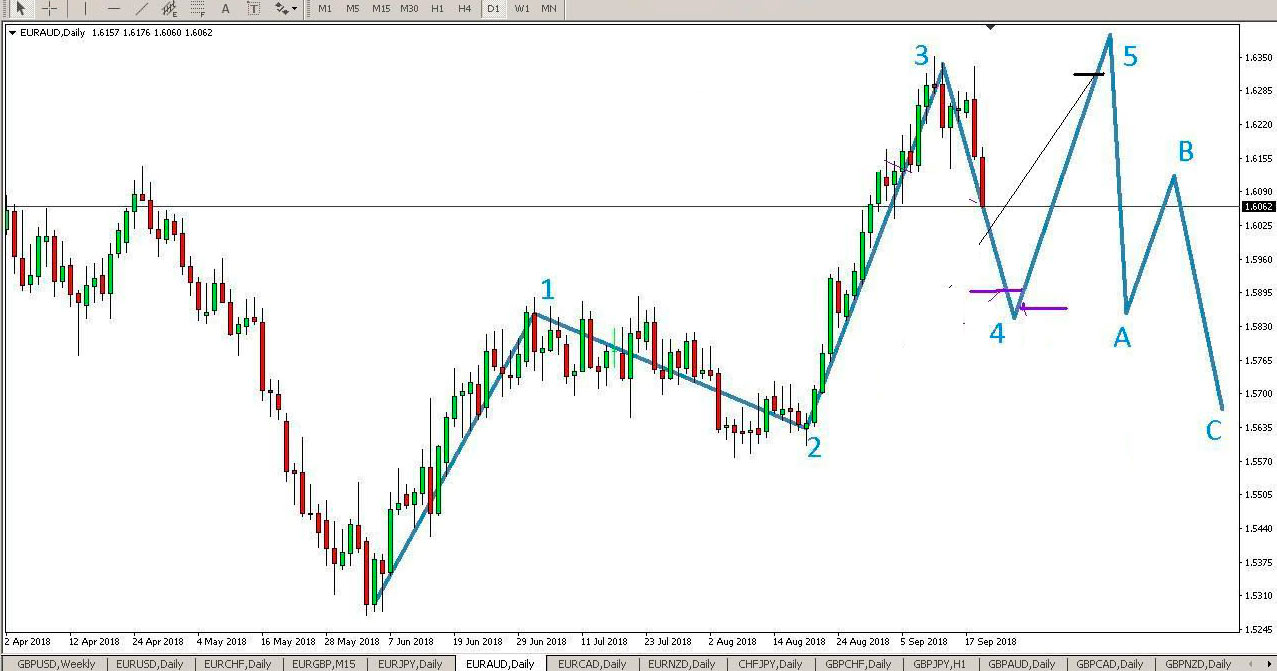
Using the EUR/AUD asset as an example, one can clearly observe the already formed wave impulses 1,2 and 3. At the moment, the 4th stage of the model construction is observed on the chart. Given the basic rules for the formation of the remaining plots, they can independently complete and predict (approximately) further price movement.
Thus, observing the correctional changes A, B, C, traders can more clearly determine the moments of entering the market. By placing pending orders, you can get real profit. This will significantly save time spent on the computer in order to analyze the market situation and find convenient moments for concluding deals.
For long-term trading (on the D1 timeframe chart), you can open a sell order right now. Profit is better to fix when the price reaches the level of the end of wave No. 1. Then it is advisable to open a buy order with fixation of take profit (Take Profit) at the level of the end of wave No. 3. Subsequently, when confirming the price forecast, transactions for the purchase or sale are concluded in the same way.
Experienced traders who employ wave analysis often use indicators. Since there is no ideal tool for building an Elliott model, traders practice a variety of modifications. Like MACD, some indicators are displayed as a bar graph. The intersection of the zero mark signals the end of the wave cycle. In certain cases, this moment is considered a signal to buy or sell (depending on the situation) the asset.
Pros and Cons of Wave Theory
Elliott waves are sometimes criticized. The subjectivity of this method, according to analysts who disagree with it, hinders its widespread practical application. Theory’s opponents consider the forecast of price movement using the wave theory to be very unreliable, especially since wave movements can be observed in any formation. Also, the complexity of this method lies in its lengthy study. It is almost impossible to master in a day, a week or a month. Sometimes the study of wave analysis takes years.
However, adherents of the theory argue that its practical application can achieve significant results in trading. A clear understanding of this method along with accumulated practical experience allows us to evaluate various scenarios of market development.


