HFM information and reviews
HFM
96%
FXCC information and reviews
FXCC
92%
FxPro information and reviews
FxPro
89%
FBS information and reviews
FBS
88%
Vantage information and reviews
Vantage
85%
MultiBank Group information and reviews
MultiBank Group
84%

XPro Markets - Boost your Technical Analysis Skills


What is your angle when trading in the financial markets? Do you opt for the technical analysis strategy or are you a "fundamentalist" when it comes to trading? To be in a better position to control your trades, it’s important to keep improving both your technical analysis and your fundamental analysis skills. This can give you a more holistic picture of the markets and eventually give you the edge you need to seize the moment.

If you continue reading below, this article will offer you a better understanding of technical analysis and the benefits of implementing it into your trading strategies.

What is Technical Analysis?

In technical analysis, price patterns and trends are observed on charts to evaluate investments and identify trading opportunities. Technical analysts monitor past trading activity and price changes and utilize them as effective indicators of a security's future price. In other words, this type of analysis is all about looking closely at charts and price movements with the aim to have a better picture of what is to come in the future.
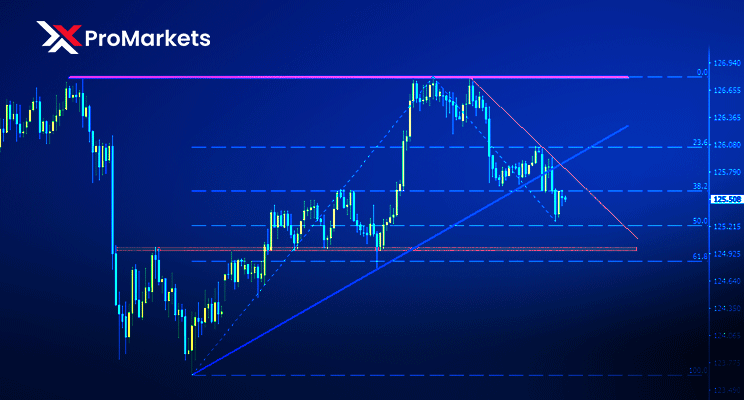
XPro Markets - Boost your Technical Analysis Skills

Technical VS Fundamental Analysis

The basic principle that will help you remember the difference between these two main schools of thought when it comes to trading analysis is that one analyzes data and the other analyzes the news. Technical analysis looks at data gathered from price movements and trends of CFDs in an attempt to predict future price movements.

On the other hand, fundamental analysis focuses on economic news and market updates that impact your assets. Every economic event has the power to change the market overview.

This is why traders need to stay up to date with everything that has to do with the global economy because this can help them think out their next move more easily and effectively.

Basic Technical Analysis Indicators

Technical analysis trading can be supported by a wide range of patterns and signals developed through research. Various types of trading systems have also been developed by technical analysts to help them forecast price movements. There are many indicators available for identifying current market trends, including support and resistance areas, as well as those that assess the strength and longevity of a trend.

The following are some of the most common technical indicators and chart patterns: Trendlines, Channels, Momentum Indicators, and Moving Averages.

Level up your Trades

Want to build your ultimate trading strategy? Focus on combining technical and fundamental analysis so you can increase your confidence in the markets. Your XPro Markets account grants you access to Trading Central’s cutting-edge technical indicators and your real-time economic calendar to keep track of your trades. Log in now to find out more!

Risk Warning: Contracts for Difference (‘CFDs’) are complex financial products, with speculative character, the trading of which involves significant risks of loss of capital. 
Disclaimer: This material is considered a marketing communication and does not contain, and should not be construed as containing investing advice or a recommendation, or an offer of or solicitation for any transactions in financial instruments or a guarantee or a prediction of future performance. Past performance is not a guarantee of or prediction of future performance.

#source


RELATED

Depth Of The Market: Definition And Meaning

Depth of the Market is a special technical indicator developed for the MetaTrader 4 terminal. It is designed to monitor the current price movement and also to determine the supply and demand zones...

Everything To Know About a Crypto Bear Market

When you hear the term "bear market", it typically means that a market has dropped by over 20%. This harkens back to Wall Street, which uses the term bear market to describe when large amounts of losses have been realized...

How to Calculate the Value of One Point in Forex

A point is a very important concept for calculating possible profit or loss in financial markets. When conducting transactions, you need to clearly understand how much...

Hammer Candlestick Pattern: Build Your Reliable Signal

There is a wide range of technical indicators, chart and candlestick patterns that provide signals for newbie and experienced traders. Today we will focus on...

Three technical indicators you should know about

Seeing a list of indicators, you might easily get lost. This article will help you learn about 3 essential indicators that will help you define your trading strategy for any time period...

Read the markets: Technical & Fundamental analysis

One of the biggest concepts in trading relates to Market Analysis and how to read the markets. This includes both Fundamental analysis and Technical analysis...

The Double Top Pattern: An In-Depth Guide to Mastering a Timeless Reversal Signal

While it's often claimed that markets are unpredictable, there's a method to the madness. Certain price chart patterns like the double top pattern offer a systematic way to read market movements, acting as historical footprints that signal future trends...

What Is Crypto On-Chain Analysis? Definition & Meaning

Blockchain transaction data is publicly available, creating possibilities for data science and machine learning. All trading and investment activity can be extracted from the public...

Technical Analysis Tools

Read on to find out about some of the most popular technical analysis tools that traders can use, such as Bollinger Bands, MACD, and RSI...

A Comprehensive Guide to Technical Analysis: Definition, Tools & Examples

Technical Analysis is a systematized approach employed by traders to predict price movements and trends by examining market data, primarily price and volume...

Bullish vs. Bearish Market: How to Distinguish

In trading, you should focus not only on learning new strategies and indicators but also on discovering the terms that are widely used within the trading community. This will help...

Mastering the Intricacies of Short-Term Trading Analysis

In the bustling corridors of the financial world, short-term trading stands out as a high-octane race, demanding lightning-fast reflexes, unwavering focus, and an adept understanding of market nuances...

Fundamental Analysis Explained: A Trader’s Tools For Profitability

What is Fundamental Analysis? There are many ways to define fundamental analysis, but breaking it down to as simple terms as possible, it is the study of the underlying...

What is technical analysis?

Technical analysis in one of the most widely used methods of forecasting price movements. The basis behind this type of analysis is the supposition that on the market...

Types of analysis when trading in financial markets

It is well known that trading in the financial markets is one of the most dynamic and effective ways to make a profit, even in the absence of significant initial capital...

ADX: Find the Strong Trend

In a wide variety of indicators that provide different signals, it's almost impossible to find the one that defines the trend's strength. It's vital to know whether the trend is stable or not, especially during...

Support and Resistance Levels: Comprehensive Overview and Practical Approaches

Support and resistance levels are paramount concepts, pivotal in navigating Forex and various financial markets. These levels underpin myriad trading strategies and form the foundational framework...

A Pullback: Trade Against a Trend

Reading analytical outlooks on the price movements, you might be met with the word “pullback”. Many trading strategies are based on a pullback action...

Japanese Candlestick Chart Analysis

The most convenient option for charting any asset on Forex is Japanese candles. The information content and the state of the market's data...

Technical analysis: what separates the pros from the schmoes

In essence, technical analysis hinges on the study of past price movements and trends to predict future market developments. It first emerged as a tradition...

XM information and reviews
XM
82%
FP Markets information and reviews
FP Markets
81%
FXTM information and reviews
FXTM
80%
AMarkets information and reviews
AMarkets
79%
Octa information and reviews
Octa
79%
BlackBull information and reviews
BlackBull
78%

© 2006-2024 Forex-Ratings.com

The usage of this website constitutes acceptance of the following legal information.
Any contracts of financial instruments offered to conclude bear high risks and may result in the full loss of the deposited funds. Prior to making transactions one should get acquainted with the risks to which they relate. All the information featured on the website (reviews, brokers' news, comments, analysis, quotes, forecasts or other information materials provided by Forex Ratings, as well as information provided by the partners), including graphical information about the forex companies, brokers and dealing desks, is intended solely for informational purposes, is not a means of advertising them, and doesn't imply direct instructions for investing. Forex Ratings shall not be liable for any loss, including unlimited loss of funds, which may arise directly or indirectly from the usage of this information. The editorial staff of the website does not bear any responsibility whatsoever for the content of the comments or reviews made by the site users about the forex companies. The entire responsibility for the contents rests with the commentators. Reprint of the materials is available only with the permission of the editorial staff.
We use cookies to improve your experience and to make your stay with us more comfortable. By using Forex-Ratings.com website you agree to the cookies policy.