The price of the USDCHF currency pair, on the D1 time-frame, was in an extensive descending path until August 31 when a lower bottom was recorded at 0.89975. The bulls found the price at that level attractive and they started entering the market with long positions.
After Swissy hit the bottom at 0.89975, a possible price reversal or early stage of a new trend was confirmed when the currency pair broke through the 15 and 34 Simple Moving Averages and the Momentum Oscillator crossed into positive territory by breaking the zero baseline.
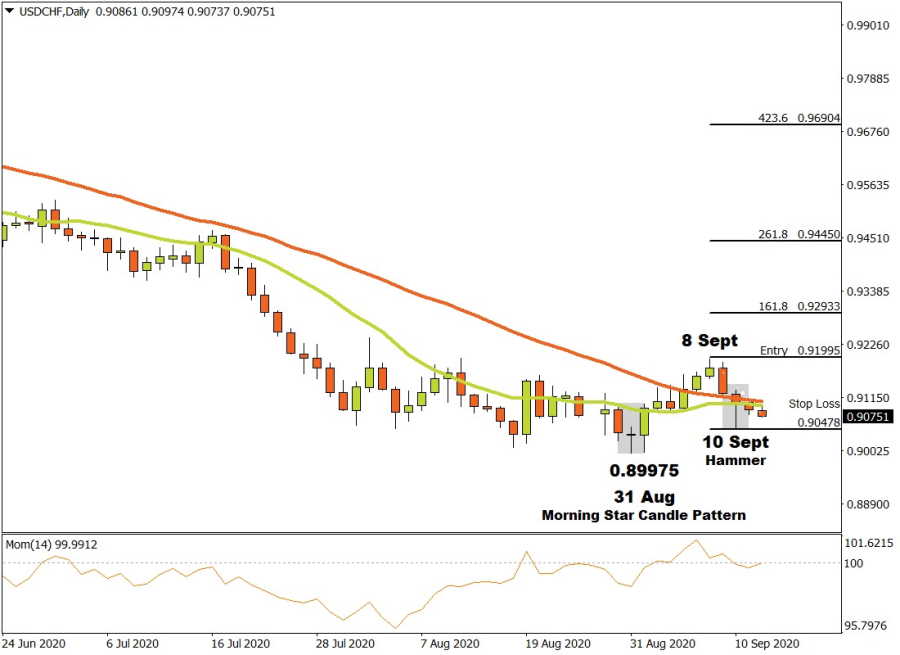
During the bullish move, a Morning Star Candle pattern was formed and it further confirmed the possible change of fate of the Swissy to the greens.
A possible critical resistance level was formed when a top was reached on September 8 at 0.91995. The bears then tried to push the price lower but a Hammer Candlestick pattern formed on September 10 at 0.90478, indicating that that a possible support level may have been reached.
If the Swissy breaks through the critical resistance level at 0.91995, then three possible price targets may be calculated from there. Applying the Fibonacci tool to the top of the resistance level at 0.91995 and dragging it to the possible support level at 0.90478, the following targets may be considered. The first target could be estimated at 0.92933 (161 %). The second price target might be considered at 0.94450 (261.8%) and the third and final target may be projected at 0.96904 (423.6%).
If the 0.90478 support level is broken, the anticipated price targets above are annulled. Should the Swissy continue to make higher tops and bottoms, it will confirm that an uptrend is in place and the outlook for the USDCHF currency pair on the Daily time-frame will be bullish.