The fall in global financial markets, which began in February 2020, is associated with the COVID-19 pandemic. Moreover, it is not the disease itself that causes greater economic damage, but measures to curb the spread of the new coronavirus. Economic and social activity in all countries declined sharply. This puts powerful pressure on stock prices, commodities and other risky financial assets. Unprecedented measures of monetary and fiscal support are designed to mitigate the crisis in the financial markets, but it is obvious that a steady recovery of the global economy and markets will be possible only after weakening or complete lifting of quarantine measures.
An estimate of the current pandemic duration may be of great interest to investors, namely, the moment of the reversal of trends in morbidity / mortality, after which one can hope to ease quarantine and gradually restore economic activity. Of course, neither doctors nor analysts have an accurate forecast of the peak incidence rate. For a rough estimation of the dynamics of the distribution of COVID-19, let us resort to historical experience.
Spanish flu is considered the most widespread flu pandemic in human history. The disease lasted from 1918 to 1920. During this time, according to the American CDC, about 550 million people were infected and at least 50 million died. The development of medicine in the 21st century will help to avoid such a negative outcome in the current pandemic. However, the development of communications and the increased mobility of mankind has led to such a rapid spread of the disease to all continents, and this may interfere with the effective containment of the COVID-19 pandemic.
Despite the fact that technology and medicine in 2020 are significantly different from what they were in 1918, it seems that social distance is still the most effective way to deal with a pandemic - closing social gatherings: educational institutions, theaters, restaurants, etc. The causative agents of the infection, influenza virus and coronavirus, are similar in that they can lead to serious respiratory consequences. National Geographic in its article gives an example of the dynamics of the incidence of "Spanish Flu" in American cities in 1918-1919.
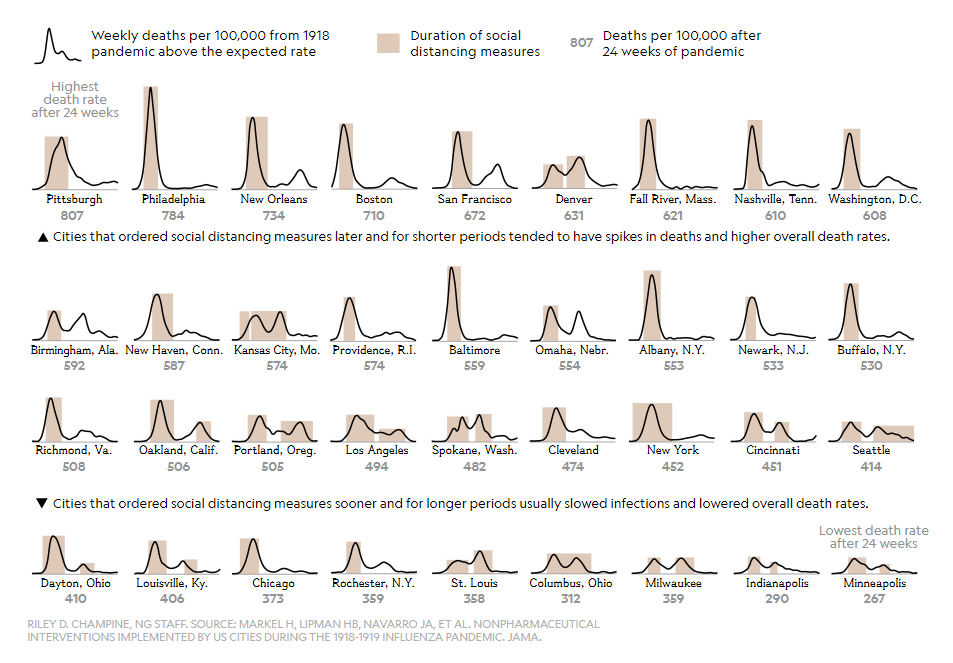
Based on National Geographic materials and the above illustration, several important points can be noted:
- First, the jump in influenza mortality in some US cities was significantly higher than in others. The authors of the study indicate that the sooner measures to limit social activity were taken and the longer they continued, the smaller the surge in mortality from the disease was.
- Secondly, the period of strict restrictive measures application varied between cities from about 4 to 12 weeks, that is, an average of 8 weeks. Perhaps the same time frame should be counted in the case of COVID-19. Given the greatly increased number of ties within both the local and global economies, the earlier removal of strict quarantine in some places will not lead to a rapid restoration of economic activity without similar actions in others. We are seeing a similar situation now in China, when the restart of the economy does not provide significant support to the stock markets, even local ones.
Another important observation is that in almost every city after passing the peak of the first wave of incidence, we see a second surge with a peak approximately 8-10 weeks after the formation of the first extremum. As a rule, the second wave is less serious, but in some cases, it turns out to be more significant than the first. In the case of COVID-19, a second burst of incidence cannot be ruled out, although its dynamics will depend on the severity and duration of current measures to limit social activity.
According to WHO data, the peak in the spread of the COVID-19 pandemic in China has passed. Restrictive measures are mitigated, and social and economic activity is restored. Probably, investors need similar information on Europe and the USA to change sentiment in the market. But, judging by the data of the European Center for Disease Prevention and Control (ECDC) and the American Disease Control and Prevention (CDC), it’s too early to talk about the passage of the peak.
In the United States, an active increase in the incidence of COVID-19 began two weeks ago. Under strict quarantine conditions, one would hope that the peak incidence would pass in 6–8 weeks. But the American president is reluctant to take measures to severely restrict citizens' freedoms. He abandoned the intention to enforce strict quarantine in some states. Current measures to reduce social activity are called "urgent recommendations regarding travel."
Donald Trump, in turn, expects a peak in mortality from coronavirus in the United States in two weeks, and previously introduced measures to limit the social activity of Americans will be extended until April 30. He also hopes that by June 1, the country will be "on the road to recovery."
The volatility in financial markets has taken aback the vast majority of investors and even experienced speculators. The deepening global humanitarian and economic crisis leads to disputes between market participants about the future of the global financial system. The obvious downtrend is causing many investors to reject risky assets. Some investors, on the contrary, consider the market decline as a unique opportunity to acquire assets at an irrational price, from their point of view. But excessive uncertainty leads to chaotic market movements.
What caused such a scale of market decline in such a short time?
The main reason for the markets’ almost folding lies in the unexpected scale of the coronavirus spread. The “black swan” expected for many years has flown in from where nobody did not wait. Statistics on the infection dynamics and mortality of the coronavirus leads to fear of the unknown.
Barriers erected around the world to spread the infection increase panic. As a result, consumer activity is minimized, people try to accumulate as much cash as possible. In a situation of investors’ multiple “exits” from risky assets, there is a shortage of demand, and prices naturally fall.
Let us remind you of the definition of liquidity as the ability of an asset to be exchanged for cash in the shortest possible time and without significant losses. It is the extreme volatility of the last month that is associated with a lack of liquidity for large institutional investors to fulfill their obligations. In conditions of low demand for securities, we observe a sharp drop in their value in a fairly short time interval.
What are the landmarks for the fall? Where is the bottom?
Determining the bottom of the fall is now akin to divination. No one can say for sure where the boundaries of the scale of the pandemic spread and how long the measures that limit the spread of the infection will be applied.
You can only select a few indicators that can diagnose the stabilization of the situation and the beginning of the market recovery process. First, the dynamic nature of the spread of the epidemic should be taken into account. In recent weeks, we have observed an acceleration in growth of both absolute indicators in terms of the number of infected people, and, unfortunately, relative indicators indicating the lethality of the coronavirus. Slowing growth rates will signal the approach of a peak pandemic.
The second important point is volatility. There is the so-called VIX “fear index” showing the future sentiment towards the global American stock market. The growth of volatility indicates gloomy prospects for the value of securities in the eyes of investors. Thus, stock prices and volatility are moving in different directions.
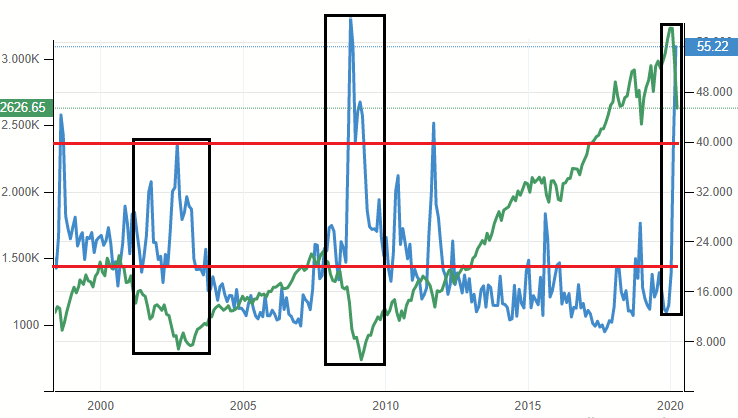
The horizontal red lines in the figure indicate the average historical value of the index (the lower line is the parameter of 20 p.) And the border is “panic” (the upper line is the parameter of above 40 p.).
Extreme values ​​of volatility indicators reflect the complete rejection of risky assets. Statistically, finding the indicator of fear in the region of maximum values ​​leads to an oversupply of participants to sell and the absence of buyers. If the majority of market participants are so unanimously confident in any trend, as a rule, it is precisely at these moments that its turn is observed.
It is especially important to correlate the dynamics of volatility indices and stock indices. For example, on the March 20, the following situation was observed: the S&P 500 American stock index continued to plummet, rewriting three-year lows, and the VIX index stopped updating its local highs. At this moment, a change in short-term sentiment was diagnosed.
At that moment, future valuations began to shift in a positive plane relative to current prices of risky assets. After which we observed the historical growth of the US stock market. In the last week of March, the US stock market showed one of the best gains in the market value of securities, up almost 20%. The VIX volatility index at the moment fell below 40 p.
As for the depth of the fall in macroeconomic indicators of the global economy, the “best” of possible outcomes will be the “W-shaped” GDP recovery according to our estimates, when, after the first shock from the pandemic, the global economy will experience difficulties up to the third quarter 2020 against the background of only a gradual resumption of production and consumer activity.
Oil has already fallen 3 times since the beginning of the year and the end of the collapse is not visible, what can we expect until the end of 2020?
Indeed, the price of oil collapsed about 70% from the January highs and now stands at about $27 under the June contract for Brent. We observe levels of 20 years ago.
The main factor in the fall of black gold is a sharp drop in global demand amid a halt in industrial enterprises, transport, and restrictions on population movement. According to a number of estimates, we can talk about a drop in demand of more than 10 million barrels per day, which in the pre-crisis state is equivalent to about 10% of the daily world consumption of raw materials. Such a drop in volumes cannot be made up for by any decrease in production by leading exporters. The rejection of the obligation to extend the OPEC + transaction increases the negative pressure on prices.
As oil prices are kept at low levels, the financial performance of oil and gas companies in the world is expected to deteriorate. Investment projects to develop new deposits and increase the efficiency of existing ones become unprofitable, payback periods become unpredictable. In this case, a natural decrease in production activity and a drop in the supply of raw materials to the market are logical. Ultimately, a combination of factors of low seller activity due to its loss making and the start of global demand recovery will lead to an inevitable balance of interests. The price of oil will start to rise.
According to our estimates, based on extrapolating the results for Chinese industry, where about 80% of production returns to levels before the epidemic, an upward formation of oil prices can begin in the second half of the second quarter. By the end of 2020, the probability of seeing a move to $35–45 on Brent prevails.
Will world governments manage to cope with the crisis?
The extent of monetary stimulus and fiscal easing in recent weeks is unprecedented. In fact, the monetary authorities launched unlimited programs to support financial institutions in order to protect the market from collapse.
A liquidity crisis in a situation of industry shutdown and a sharp drop in consumer demand is an explosive mixture. Thus, the factor of pressure on the market from fears of bankruptcy of international credit organizations has now weakened, but has not disappeared.
The fiscal policy of many states is designed to smooth out the negative effects of restrictions and provide support to people in difficult life situations. The continued nature of barriers will seriously impact business processes and, ultimately, the labor market. The speedy passage of the humanitarian crisis and the achievement of sustainable indicators of reducing the infection become more urgent in such a situation. The most important role is played by the citizens’ responsibility for themselves and for their loved ones.