FXTM information and reviews
FXTM
95%
OctaFX information and reviews
OctaFX
94%
XM information and reviews
XM
93%
FXCC information and reviews
FXCC
92%
HFM information and reviews
HFM
91%
FxPro information and reviews
FxPro
89%

How to Use 3 Popular Types of Forex Charts


4 April 2022

Whether you're a beginner or a more experienced trader, you need to be comfortable with technical analysis in order to make better trading decisions. To be able to predict how a currency pair's price will move in the future, you must have some means to analyse its historical and current price behaviour. Thus, every trader using technical analysis needs to learn how to read price charts.  

Keep reading the article below to get the basics on 3 popular Forex Charts so you can feel more confident in the markets.
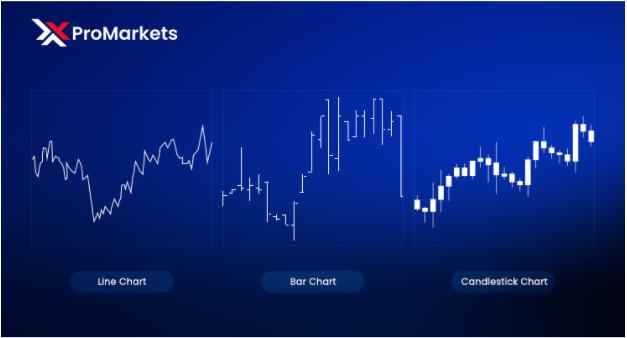
XPro Markets Forex Charts

What are Forex Charts?

Simply put, a chart is a visual representation of how a currency pair's price changes over time. Price charts are a reflection of supply and demand, including the effects of economic events and future price predictions made by traders. Every time a chart is updated, it shows every buy and sell transaction that took place for that financial instrument (in this case, currency pairs).

3 Popular Types of Price Charts

Let’s take a look at 3 of the most frequently used types of price charts.

Line chart

In a simple line chart, one line connects one closing price with the next closing price. The price movement of a currency pair can be observed when it is strung together with a line over time. However, this means that the only information you actually have is what the closing price was. Nevertheless, it allows traders to visualise trends and compare closing prices across periods more easily. It is easy to determine trends through a line chart since it is simply the slope of the line.

Bar chart

This type of chart is a little more complex. This chart shows both the opening and closing prices, as well as the highs and lows. In this way, it can help traders determine the price range of each period. It’s important to know that the bottom of the vertical bar depicts the lowest traded price for that time period and the top of the bar reflects the highest price. Thus, the vertical bar represents the currency pair’s trading range. To make things even more clear, the bars become larger when price fluctuations are highly volatile and smaller when fluctuations are more subdued.

You should also keep in mind that the horizontal lines attached to the price bar record the period's opening and closing prices. The horizontal hash on the left side of the bar indicates the opening price, and the horizontal hash on the right side indicates the closing price.

Candlestick chart

In simple words, candlestick charts show the same price information as a bar chart but in a more visual and direct manner. Although there is still a vertical line indicating highs and lows, the larger block in the middle indicates the range between opening and closing prices. By displaying different colours on the body, candlesticks illustrate bullish or bearish sentiment. The currency pair closes lower than it opened if the middle block is filled in or colored in. A closing price that is higher than the opening price will result in the middle block appearing "white" or hollow.

 Which Forex Chart is the Best to Use?

Due to the various types of charts available and the different trading styles that exist, we cannot really say that one chart is better than the other. Each trader is different when it comes to strategy preferences and skills. Moreover, please remember that each chart will have its own advantages and disadvantages. While you may choose to use a specific type of forex chart or use multiple, it all depends on your likings.

If you’re still not sure which chart is the best one for you, log in to your account to get more information through XPro Markets’ educational resources.

#source

Share: Tweet this or Share on Facebook


Related

XM Receives Award at Finance Magnates Africa Summit

From May 8th to the 10th our team in South Africa was at the first ever Finance Magnates Summit (FMAS:23). XM was there as Diamond Sponsor, and during the summit, we were honoured with the Best Customer Service in Africa award...

30 May 2023

Five Reasons for Copy Trading: Unlocking Your Financial Potential

With the social trading sector expected to grow and reach a market size of $3.77 billion by 2028, copy trading, a form of social trading, is fast becoming a popular way for traders to achieve their financial and trading goals...

29 May 2023

TRXUSD now available on OctaFX trading platform

TRXUSD is a popular high-cap cryptocurrency used on the TRON blockchain platform. With the addition of TRXUSD to our platform, our clients can diversify their investments and take advantage of the potential of this cryptocurrency on the market...

24 May 2023

An Introduction to Copy Trading Platforms and How to Choose One

Investing in financial markets can be both daunting and time consuming, especially for those with limited experience in trading. However, copy trading platforms offer a simple and convenient way...

24 May 2023

Planned optimization of MetaTrader 4 platform

We would like to inform you that on Saturday, May 20, 2023, from 00:30 to 22:00 EEST, the MetaTrader 4 platform will be temporarily unavailable due to the planned...

22 May 2023

T4Trade: Introduction to CFD Trading

Learn what CFDs are, the advantages and risks of trading CFDs as well as some useful tips to help you find success when trading online...

19 May 2023


Editors' Picks

FXCM information and reviews
FXCM
87%
MultiBank Group information and reviews
MultiBank Group
86%
RoboForex information and reviews
RoboForex
85%
Libertex information and reviews
Libertex
84%
Vantage information and reviews
Vantage
83%
FP Markets information and reviews
FP Markets
81%

© 2006-2023 Forex-Ratings.com

The usage of this website constitutes acceptance of the following legal information.
Any contracts of financial instruments offered to conclude bear high risks and may result in the full loss of the deposited funds. Prior to making transactions one should get acquainted with the risks to which they relate. All the information featured on the website (reviews, brokers' news, comments, analysis, quotes, forecasts or other information materials provided by Forex Ratings, as well as information provided by the partners), including graphical information about the forex companies, brokers and dealing desks, is intended solely for informational purposes, is not a means of advertising them, and doesn't imply direct instructions for investing. Forex Ratings shall not be liable for any loss, including unlimited loss of funds, which may arise directly or indirectly from the usage of this information. The editorial staff of the website does not bear any responsibility whatsoever for the content of the comments or reviews made by the site users about the forex companies. The entire responsibility for the contents rests with the commentators. Reprint of the materials is available only with the permission of the editorial staff.
We use cookies to improve your experience and to make your stay with us more comfortable. By using Forex-Ratings.com website you agree to the cookies policy.