Since its majestic ascent to the 186.45 landmark, GBPJPY has demonstrated a notable retracement in its valuation. The currency pair touched a somber point of 178.00 earlier this month. However, showing signs of resilience, it managed to pull itself back, reclaiming a position just north of the 180.00 threshold. Taking a step back to assess the landscape from August's pinnacle, a conspicuous resistance trendline emerged as a formidable barrier, effectively halting the previous week's bullish momentum at 183.80. Presently, various technical indicators have cast a shadow of uncertainty on the market. There's palpable skepticism regarding the pair's capacity to attract a critical mass of buyers, propelling it to loftier heights once more.
Delving into the specifics, the Relative Strength Index (RSI) seems to be treading water, hovering tentatively around the midline of 50. Similarly, the stochastic oscillator paints a picture of descent. Meanwhile, the Moving Average Convergence Divergence (MACD) doesn't offer much solace either. Despite its oscillations above the red signal line, its diminishing vigor in the negative spectrum implies potential headwinds for any substantial recovery.
Amid these technical narratives, the interplay between the 20- and 50-day simple moving averages (SMAs) yields a bearish crossover. This intersection has rendered the short-term outlook somewhat murky, demanding a more meticulous analysis from market participants.
From a strategic standpoint, the prevalent consensus leans toward sellers maintaining a watchful stance. They're likely to reserve their moves until the GBPJPY dips and firmly settles below the support zone of 179.00-180.00. This particular region is underpinned by the 23.6% Fibonacci retracement of its preceding bullish phase and is flanked by a duo of instrumental constraining lines. Should this bearish hypothesis materialize, we might witness the pair retreating to seek refuge between the 38.2% Fibonacci marker of 175.85 and June's historical obstruction at 174.50. Following this trajectory, the safety net of the 200-day SMA, coupled with the 50% Fibonacci anchor, is anticipated to mitigate further losses around 172.50. Nevertheless, a breach of this bastion could recalibrate the medium-term outlook, potentially triggering a precipitous slide toward the 61.8% Fibonacci level at 169.13.
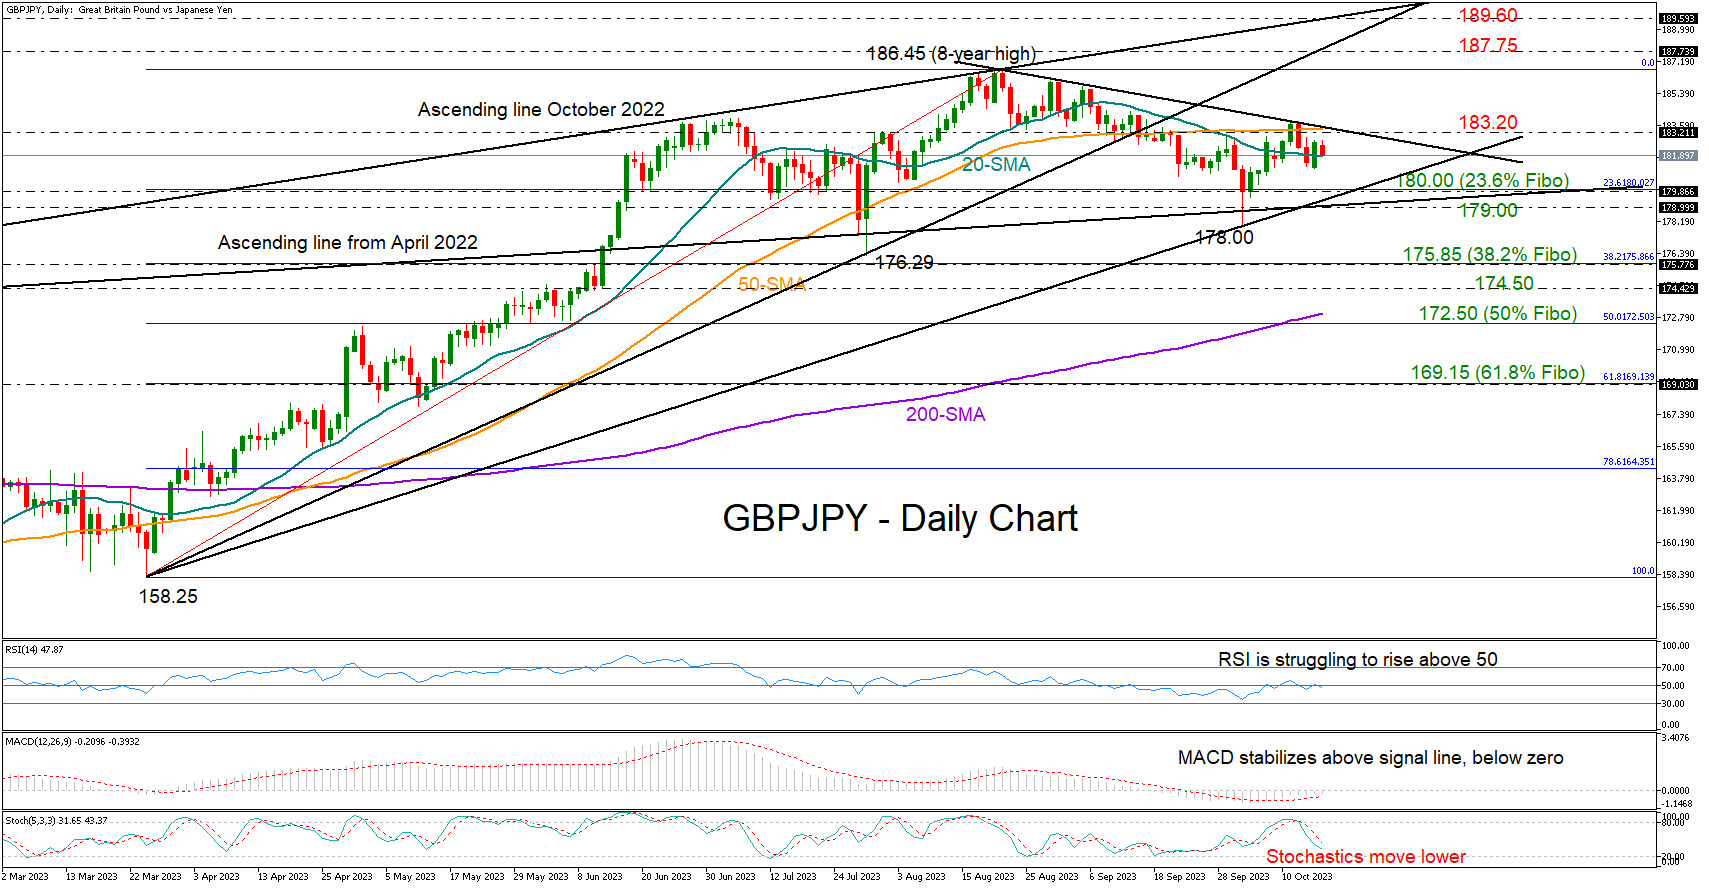
On the flip side, if bullish sentiments reignite, a renewed assault on the proximate resistance trendline and the 50-day SMA at 183.20 is plausible. Triumph in this arena might pave the way for a robust surge, potentially revisiting the venerable eight-year zenith of 186.45 or even extending ambitions toward 187.75. Another catalyst to galvanize bullish sentiment could be a robust surge above the ascending trajectory from October 2022, stationed at 189.60.
To encapsulate, GBPJPY currently strikes a balanced chord, ensconced between the resistance echelon at 183.20 and a pivotal support corridor spanning 179.00-180.00. The breach of either boundary promises to be a bellwether, providing directional clarity for the foreseeable market trajectory.